Loading ...
Loading ...
Loading ...
Operating the instrument
R&S
®
MXO 5 Series
46User Manual 1802.3369.02 ─ 02
4.2 Touchscreen display
4.2.1 Information on the display
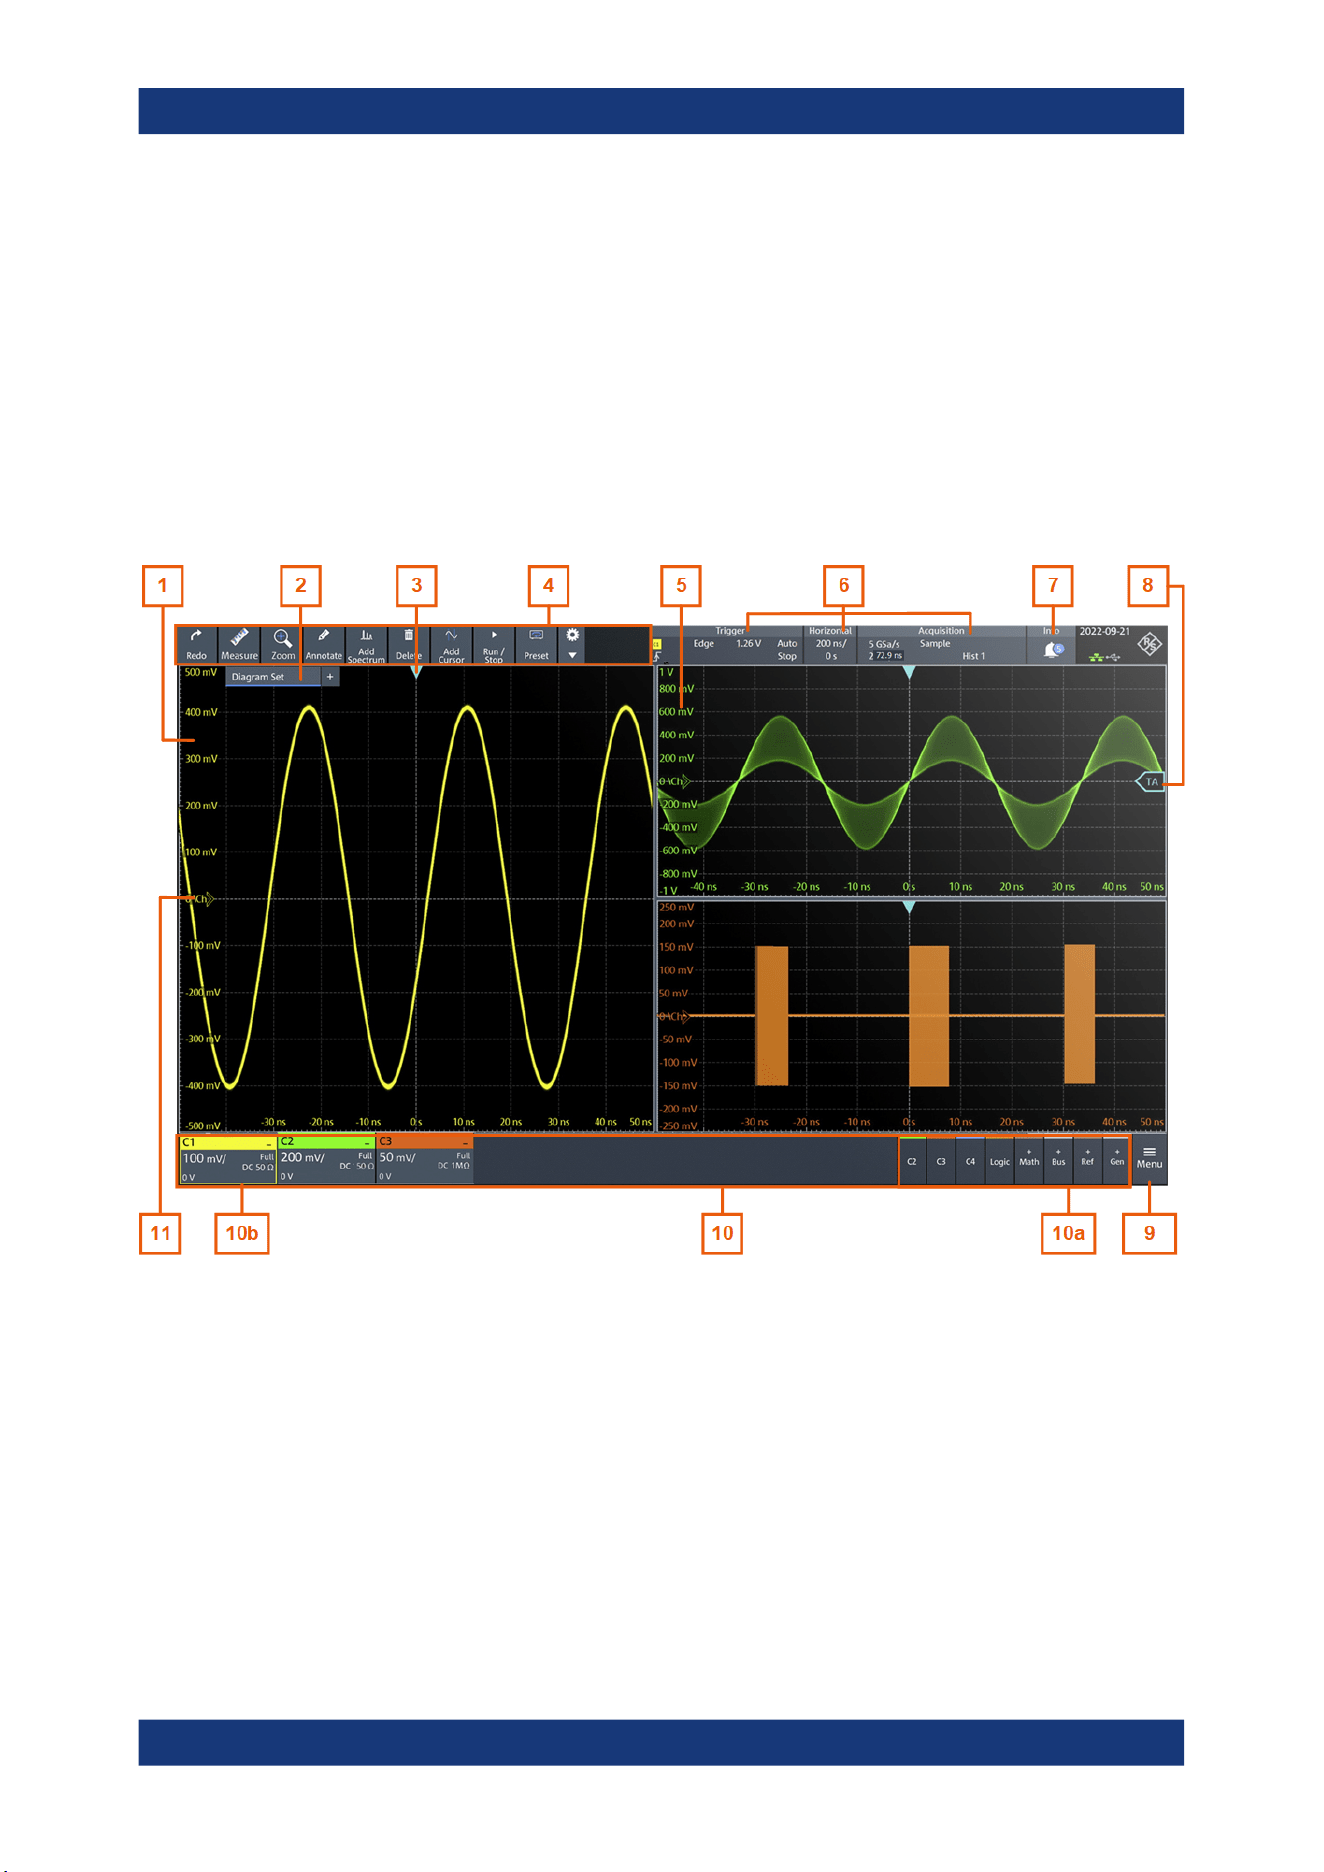
The GUI of the instrument shows the waveforms and measurement results, and also
information and everything that you need to control the instrument. All waveform-rela-
ted GUI elements are shown in Figure 4-1. An overview of control elements - like dia-
log box, toolbar - is given in Chapter 4.2.2, "Control elements on the GUI",
on page 49.
Figure 4-1: Information in the graphical user interface
1 = Diagram
2 = Layout
3 = Trigger position
4 = Toolbar
5 = Grid
6 = Trigger, horizontal and acquisition label
7 = Info
8 = Trigger level
9 = Menu
10 = Signal bar with signal activators (10a), and active waveforms (10b)
11 = Channel markers indicate the ground levels
Touchscreen display
Loading ...
Loading ...
Loading ...