Loading ...
Loading ...
Loading ...
Applications
R&S
®
MXO 5 Series
232User Manual 1802.3369.02 ─ 02
11.1.1 About the frequency response analysis plot
FRA plot display
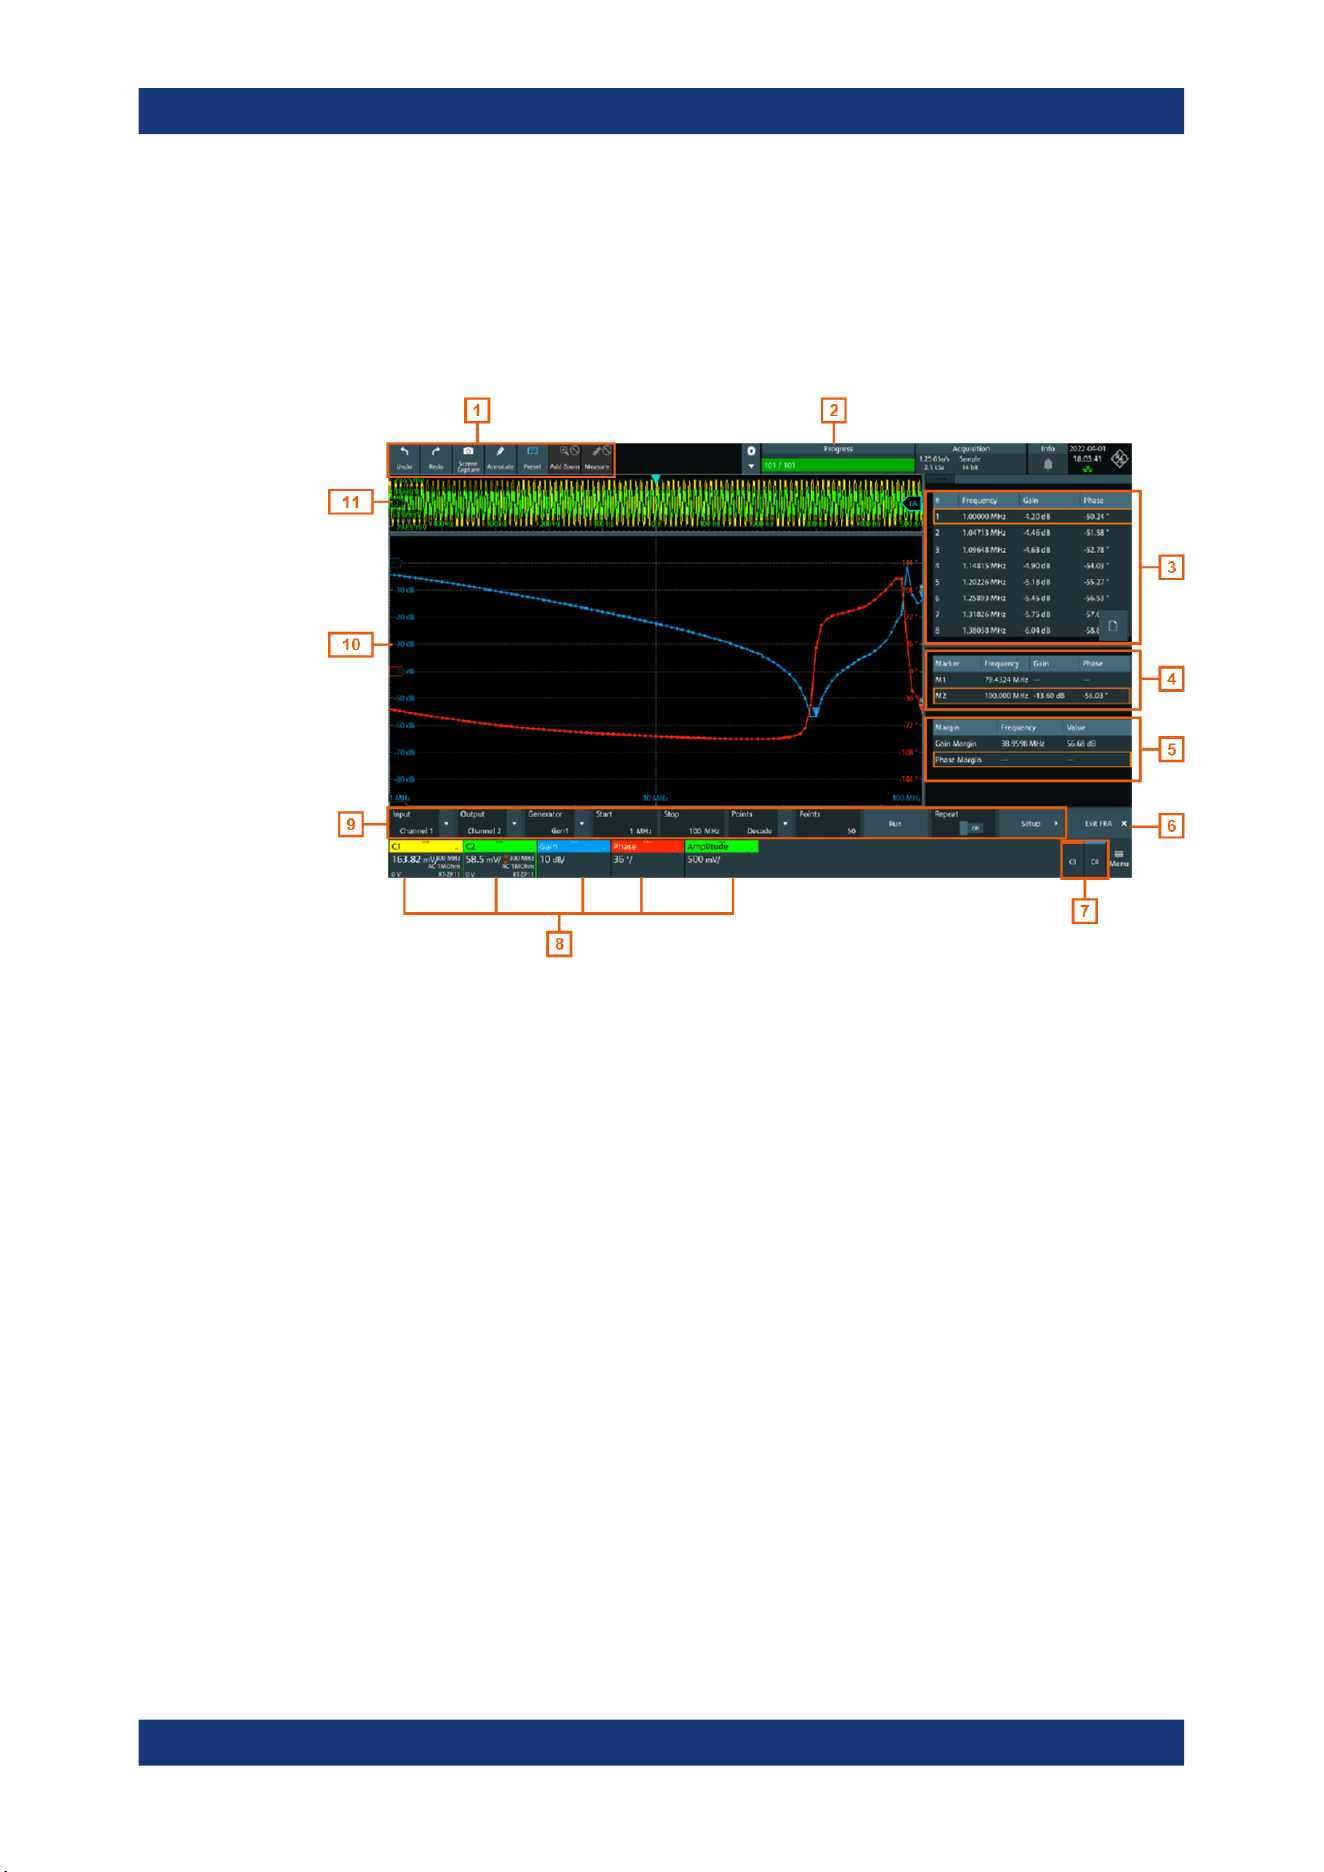
The FRA plot display is divided into several sections.
Figure 11-1: FRA plot display
1 = Toolbar
2 = Progress bar
3 = FRA result table
4 = Marker value table
5 = Margin value table
6 = Exit app button
7 = Inactive channels
8 = Active channels and plots
9 = FRA plot controls
10 = FRA plot diagram, gain: blue color; phase: red color; amplitude: green color
11 = Channel diagram
Progress bar
Displays the current status of the measurement: how many points have already been
displayed and the total set number of points.
FRA plot diagram
The FRA plot diagram has the frequency presented on the x-axis. The gain (blue color
waveform) and phase (red color waveform) scales are on the y-axis. The gain plot rep-
resents the ratio between input and output. The phase plot shows the phase shift
between input and output.
Frequency response analysis (option R&S
MXO5-K36)
Loading ...
Loading ...
Loading ...