Loading ...
Loading ...
Loading ...
Applications
R&S
®
MXO 4 Series
241User Manual 1335.5337.02 ─ 05
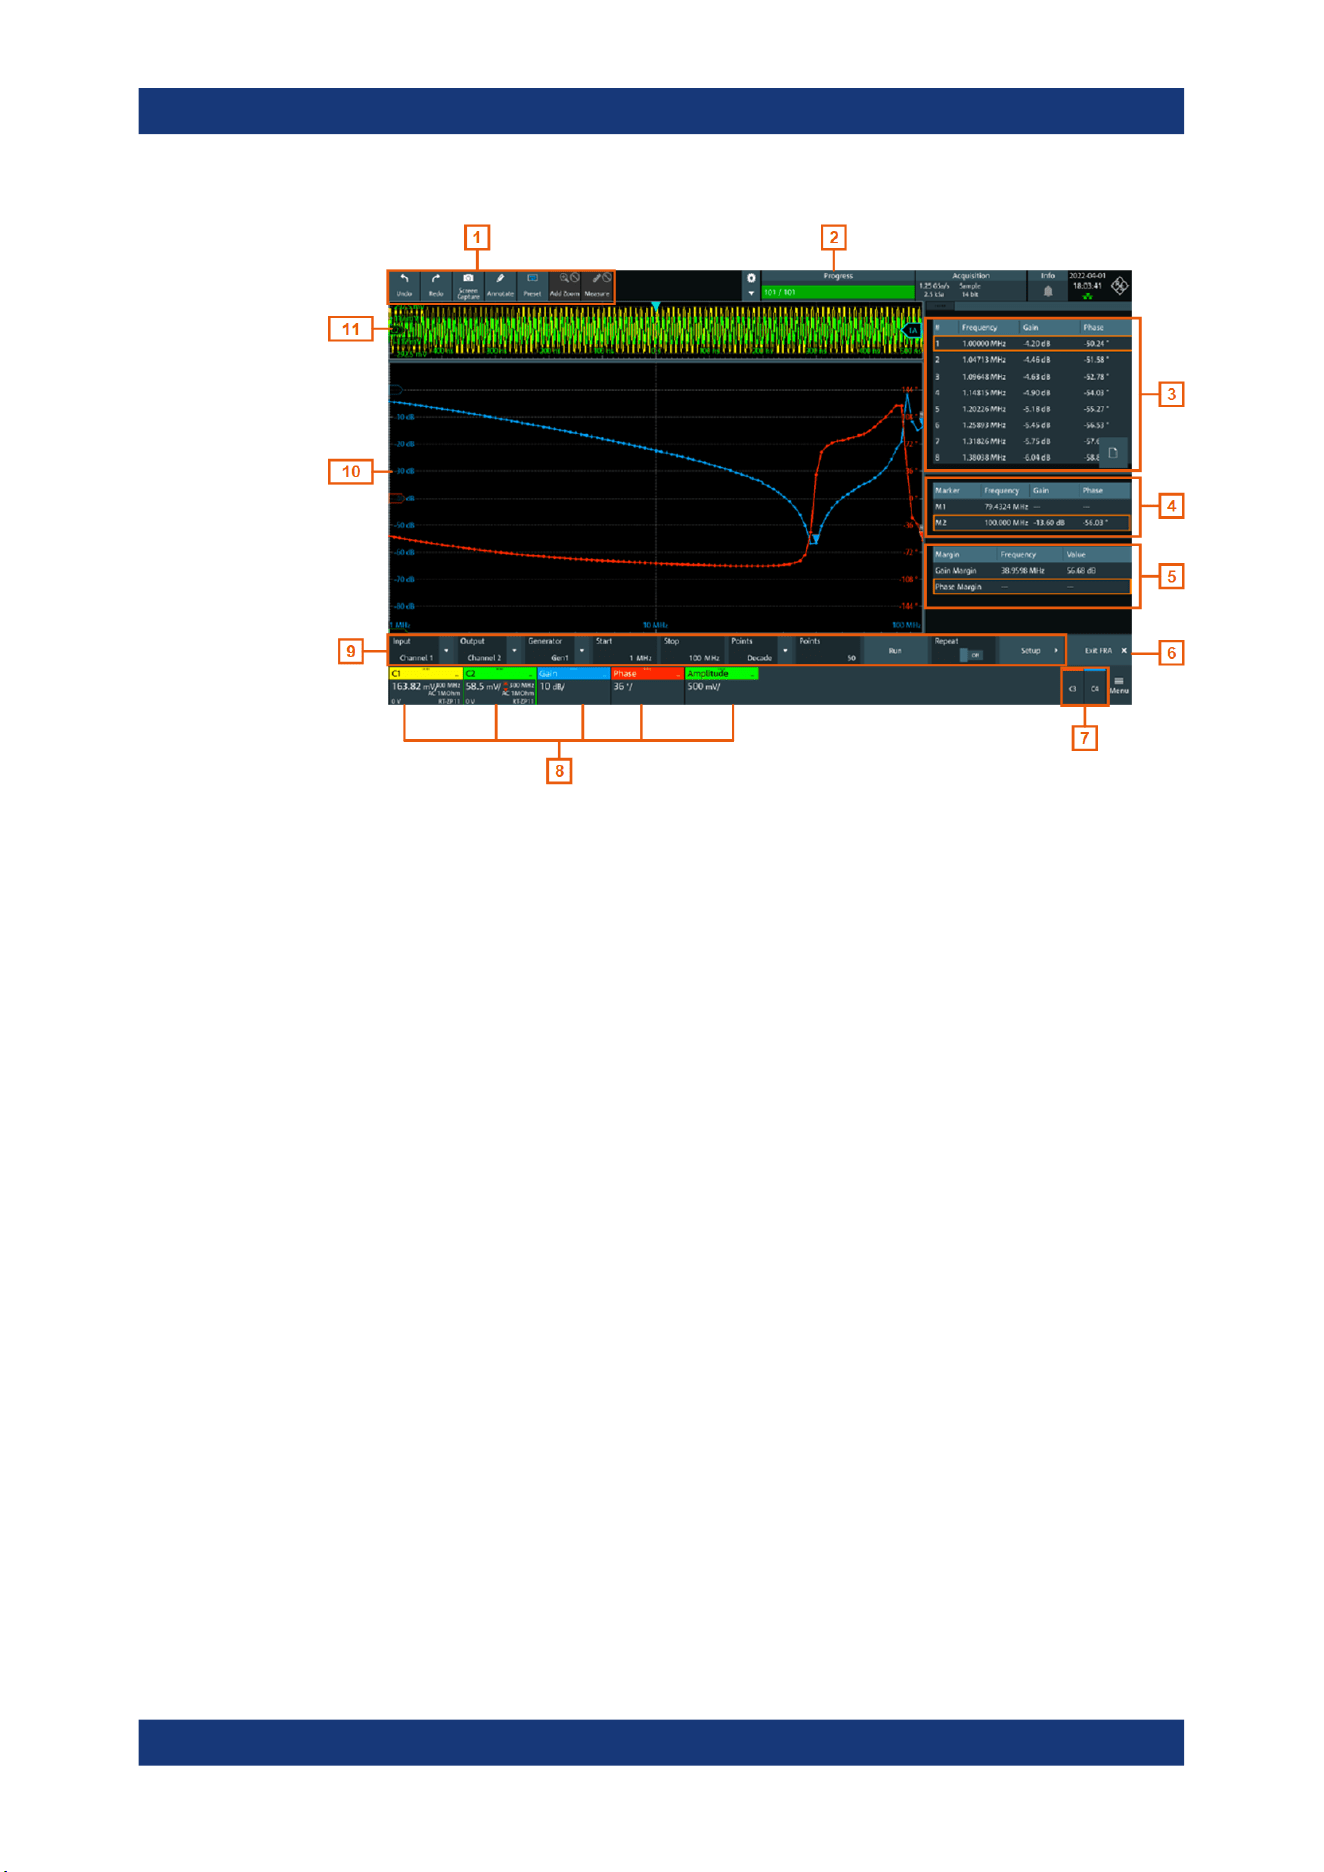
Figure 11-1: FRA plot display
1 = Toolbar
2 = Progress bar
3 = FRA result table
4 = Marker value table
5 = Margin value table
6 = Exit app button
7 = Inactive channels
8 = Active channels and plots
9 = FRA plot controls
10 = FRA plot diagram, gain: blue color; phase: red color; amplitude: green color
11 = Channel diagram
Progress bar
Displays the current status of the measurement: how many points have already been
displayed and the total set number of points.
FRA plot diagram
The FRA plot diagram has the frequency presented on the x-axis. The gain (blue color
waveform) and phase (red color waveform) scales are on the y-axis. The gain plot rep-
resents the ratio between input and output. The phase plot shows the phase shift
between input and output.
FRA plot result table
In the FRA plot result table, all sample points are displayed with the respective value
for the frequency, gain, phase and amplitude. If you select a sample in the table, the
respective points in the FRA plot are highlighted by a white line on the gain and the
phase curve.
Frequency response analysis (option R&S
MXO4-K36)
Loading ...
Loading ...
Loading ...