Loading ...
Loading ...
Loading ...
Measurements
R&S
®
RTB2000
103User Manual 1333.1611.02 ─ 03
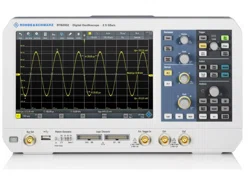
Meas. type Symbol Description Graphic / formula
Delay Dly
in s
Time difference between two slopes of the same or different
waveforms, measured on the 50% level.
Not available for cursor measurements
t
S2
S1
Phase Phs
in °
Phase difference between two waveforms, measured on the
50% level.
Not available for cursor measurements
Phase = Δt / T * 360°
t
S2
S1
100%0%
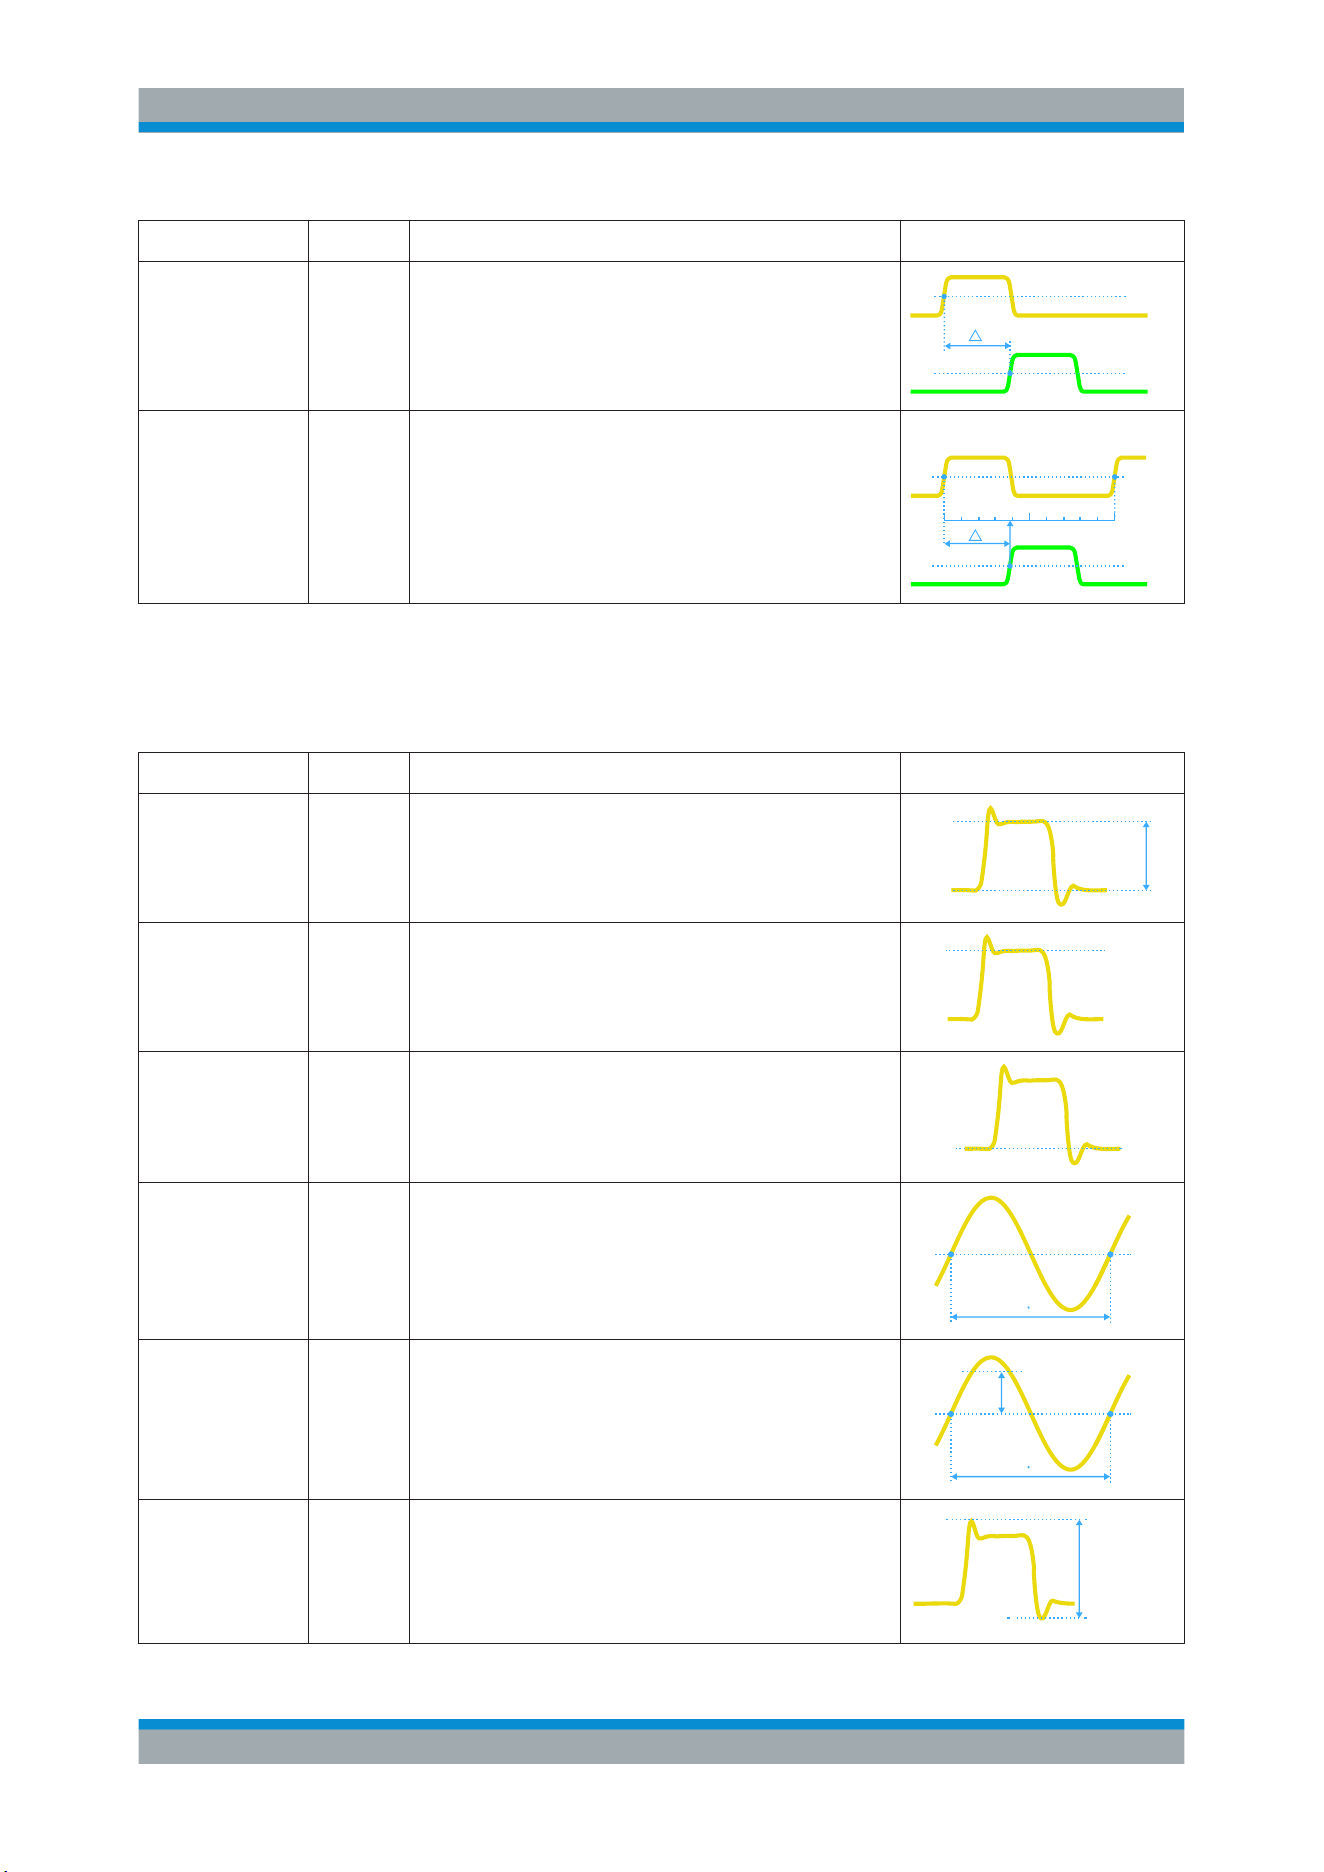
7.2.2.2 Vertical Measurements (Amplitude)
The unit of most amplitude measurement results depends on the measured source.
Meas. type Symbol Description Graphic / formula
Amplitude VAmp Difference between the top level and the base level of the
signal. The measurement requires at least one complete
period of the signal.
Top
Base
Amplitude
Top level Vtop High level of the displayed waveform - the upper maximum
of the sample distribution, or the mean value of the high
level of a square wave without overshoot. The measure-
ment requires at least one complete period of the signal.
Top
Base level Vbase Low level of the displayed waveform - the lower maximum
of the sample distribution, or the mean value of the low level
of a square wave without overshoot. The measurement
requires at least one complete period of the signal.
Base
Mean cycle MeanCyc
in V
Mean value of the left-most signal period.
DC
N T
RMS cycle RMS-Cyc
in V
RMS (root mean square) value of the voltage of the left-
most signal period.
DC
AC
N T
Peak to peak Vpp Difference of maximum and minimum values.
Max
Min
Pk-Pk
Automatic Measurements
Loading ...
Loading ...
Loading ...