Loading ...
Loading ...
Loading ...

show or hide the trace for the selected channel, either double-click on the chan
-
nel, or right-click on the Channels grid and select the Show Trace option in the
popup menu or select the Show trace option in the View menu.
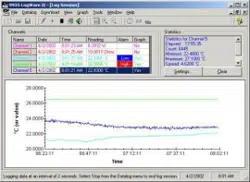
The Y-axis of the graph is always labeled in the session temperature scale that
was selected on the Log Session Settings dialog. The Y-axis is automatically
scaled to keep the entire visible portion of all traces within the graph bounds.
As traces are shown and/or hidden, the graph should automatically rescale to
maximize the resolution.
Note: For readings on all channels that are configured for non-tempera
-
ture units (i.e. Ohms or mV), the units of the Y-axis are assumed to be in
the appropriate units for that channel.
The X-axis of the graph displays the current time according to the computer’s
clock. As the traces reach the right side of the graph, the traces shift to the left
and the left-most part of the traces are pushed off the graph. The graph is set to
display 600 readings on the X-axis at a time. This setting is fixed and cannot be
changed.
Gridlines can be automatically displayed on the graph by checking the Show
gridlines on graphs option of the General tab of the LogWare Options dialog.
Please refer to Section 5.6.4.1, General Tab, for more details.
Right-clicking on the graph displays a popup menu. This menu is identical to
the Graph menu and consists of options for working with the graph during a
real-time log session. Some of the menu options apply only to the currently se-
lected channel.
There are many customizable settings for the graph such as titles, a legend,
background and text colors, grid lines and trend lines. All of these features can
be accessed by selecting the Graph Settings option in the popup menu or in the
Graph menu. The default graph settings can be restored by selecting the Re
-
store Default Settings option in the popup menu or in the Graph menu. For
more details on customizing the graph settings, please refer to Section 5.5.1,
Graph Settings Dialog.
User’s Guide
36
Figure 18 Graph popup menu
1.888.610.7664 sales@GlobalTestSupply.com
Fluke-Direct.com
Loading ...
Loading ...
Loading ...