Loading ...
Loading ...
Loading ...
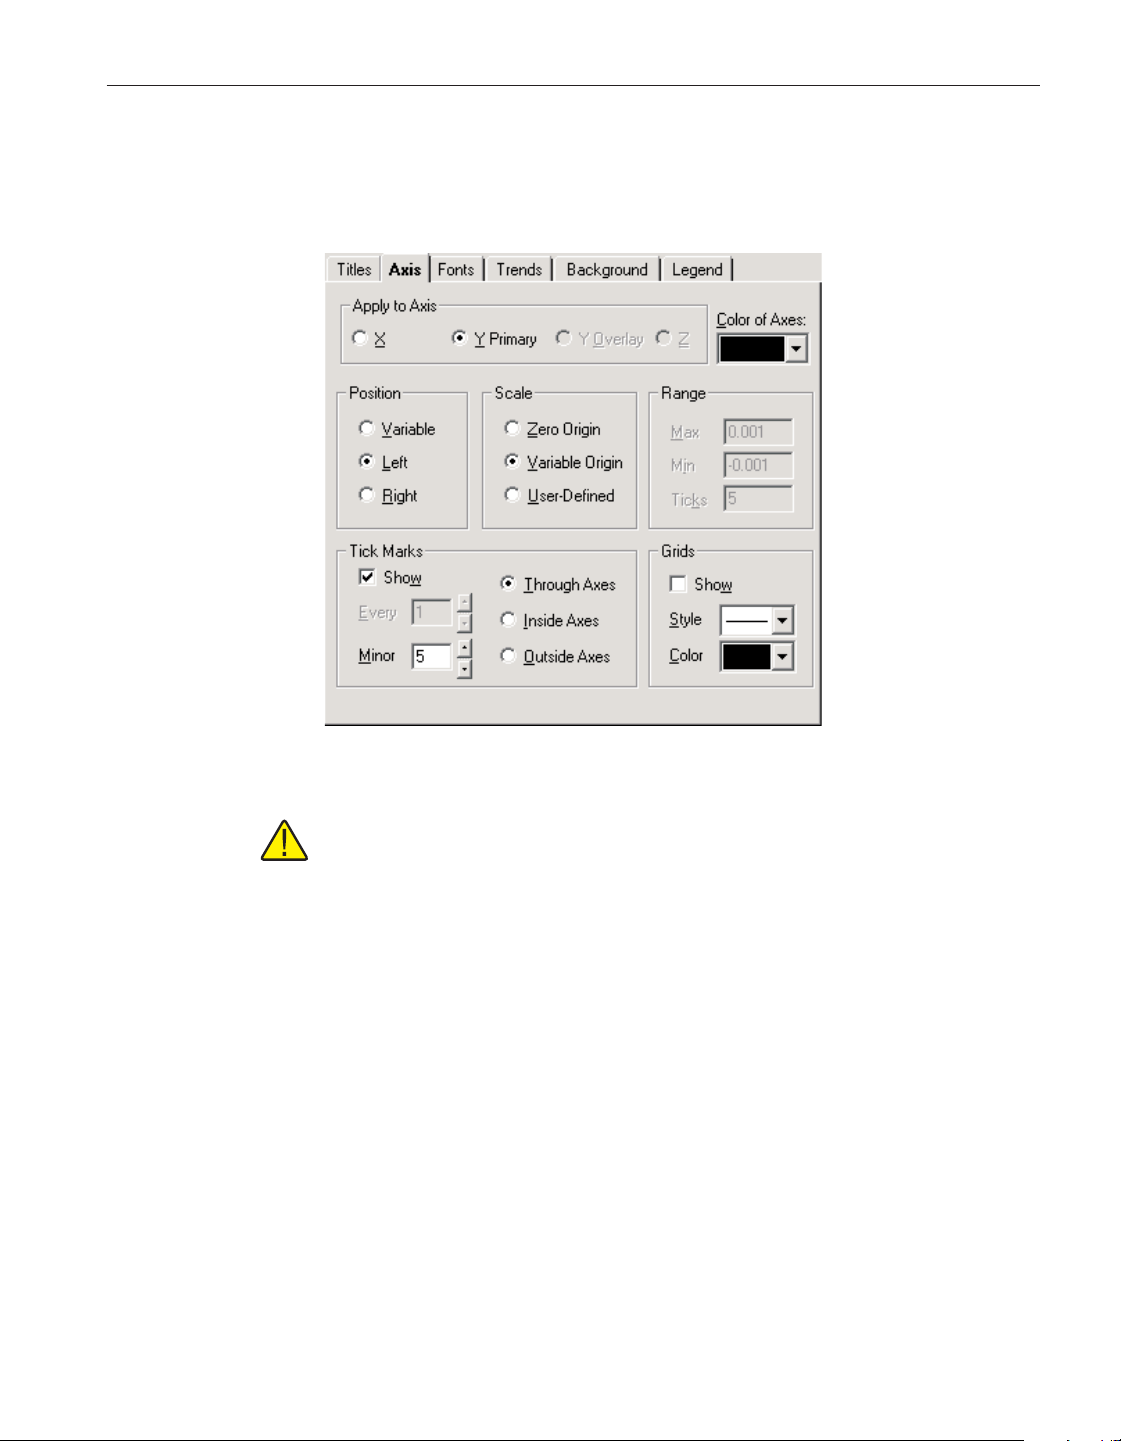
5.5.1.2 Axis tab
The Axis tab can be used to customize the graph’s X- and Y-axis settings, col
-
ors, ticks and gridlines.
Note: To restore the axes to their default settings, select the Restore De-
fault Settings option in the Graph menu.
Select the axis for which changes are to be made using the Apply to Axis op
-
tion. The other controls on this tab change to reflect the current settings of the
selected axis. By default, the Y Overlay and Z axes options do not apply to the
graph and are not enabled.
Select the color for the X-and Y-axes by selecting a color bar from the Color of
Axes drop-down list. This setting applies to both axes and is therefore inde
-
pendent of the current Apply to Axis setting. By default, this option is set to
black.
The Position options allow the X-axis to be positioned on either the top or bot
-
tom of the graph and the Y-axis to be positioned on either the left or right side
of the graph. Selecting the Variable option allows the graph itself to determine
whether to position the axes on the top, bottom, left or right side.
By default, the X-axis is set to Bottom and the Y-axis is set to Left.
The Scale options allow the user to determine the minimum and maximum val
-
ues for an axis. Each option is described below:
183
5 Menus
Graph menu
Figure 143 Graph Settings - Axis tab
1.888.610.7664 sales@GlobalTestSupply.com
Fluke-Direct.com
Loading ...
Loading ...
Loading ...