Loading ...
Loading ...
Loading ...

Note: When viewing the alarm log file while a real-time log session is
running, the File Viewer window displays only the information that had
been written to the file at the time the file was opened. Click the Refresh
button on the File Viewer window to update the file. The alarm log file can
also be printed by clicking the Print button on the File Viewer window.
The output file for each channel can be opened and viewed by selecting the
View Readings History option in the popup menu or be selecting the Readings
History option in the View menu. The output file contains all of the data that
has been logged for the selected channel during the current log session. The
output file is displayed in the File Viewer window. Please refer to Section 7.2.1,
Output File, for more information on the contents of the output file. Please re
-
fer to Section 2.4.8, File Viewer Window, for more information on using the
File Viewer window.
Note: If the data is being acquired using the Write all acquired data to the
same file option, the View Readings History feature displays all readings
for all channels!
Note: When viewing the output file while a real-time log session is run-
ning, the File Viewer window displays only the information that had been
written to the file at the time the file was opened. Click the Refresh button
on the File Viewer window to update the file. To see the statistics for the
output file, click the Statistics button on the File Viewer window. The out-
put file can also be printed by clicking the Print button on the File Viewer
window or by selecting the Print | Readings option in the File menu.
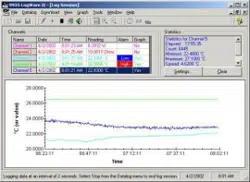
2.4.2 Statistics list
The Statistics list is located in the upper right corner of the log session window
and displays statistical information for the currently selected channel. The color
of the statistics data matches the trace color for the selected channel. Each of
the statistical settings can be enabled or disabled by clicking the Settings but
-
ton. Only the enabled statistics are displayed in the Statistics list. Please refer to
Section 2.3.6, Statistics Settings Dialog, for more information on the Statistics
Settings dialog.
Clicking the Clear button resets all statistical values for the selected channel
and begins calculating the statistical data again starting with the next reading
acquired on the selected channel.
2.4.3 Graph
The graph is located at the bottom of the log session window. The graph gives a
visual representation of the readings on all enabled channels.
The trace for each enabled channel can be toggled on or off. The Graph column
in the Channels grid indicates the current state of the trace for each channel. To
35
2 Real-time logging
Real-time log session
1.888.610.7664 sales@GlobalTestSupply.com
Fluke-Direct.com
Loading ...
Loading ...
Loading ...