Loading ...
Loading ...
Loading ...

Once the log session has been stopped, the output file which contains all of the
acquired readings can be opened by selecting the Open Previously Logged Data
File option in the View menu. For more details on opening previously logged
data files, please refer to Section 5.4.7, Open Previously Logged Data File.
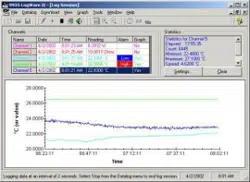
2.4.1 Channels grid
The Channels grid is located in the upper left corner of the log session window
and displays the most recent data for each enabled channel. This data includes
the channel name, date, time and value and scale of the most recent reading, the
current alarm state and whether or not the trace for the channel is currently dis
-
played on the graph. The color of the data in the Channels grid matches the se
-
lected trace color for that channel. The currently selected channel is
highlighted.
The first column in the Channels grid indicates the channel names as entered on
the Log Session Settings dialog. The second and third columns indicate the
date and time that the last reading was taken on each channel. The fourth col
-
umn indicates the last reading value and scale on each channel. The fifth col-
umn indicates the current alarm state and the sixth column indicates whether
the trace for each channel is currently shown on the graph. Each of these col-
umns may be resized as desired by dragging the lines that separate each column
with the mouse.
The current alarm state is determined by comparing the most recent reading on
each channel to that channel’s alarm settings. If the low and/or high alarms
have been configured, the reading is compared to the alarm values. If the low
alarm is enabled and the reading is less than or equal to the low alarm value,
the Alarm box in the Channel grid flashes Low to indicate the low alarm has
“tripped”. If the high alarm is enabled and the reading is greater than or equal
to the high alarm value, the Alarm box flashes High to indicate the high alarm
has “tripped”. If the reading falls between the low and high alarm values or if
the alarms are not enabled, the Alarms box remains blank (alarm reset).
Double-clicking on a row in the Channels grid toggles the state of the trace on
the graph. The current state for each channel is indicated in the Graph column.
Right-clicking on the Channels grid displays a popup menu. This menu consists
of some of the more common options for working with channels during a
33
2 Real-time logging
Real-time log session
1.888.610.7664 sales@GlobalTestSupply.com
Fluke-Direct.com
Loading ...
Loading ...
Loading ...