Loading ...
Loading ...
Loading ...
Analysis
R&S
®
RTC1000
72User Manual 1335.7352.02 ─ 04
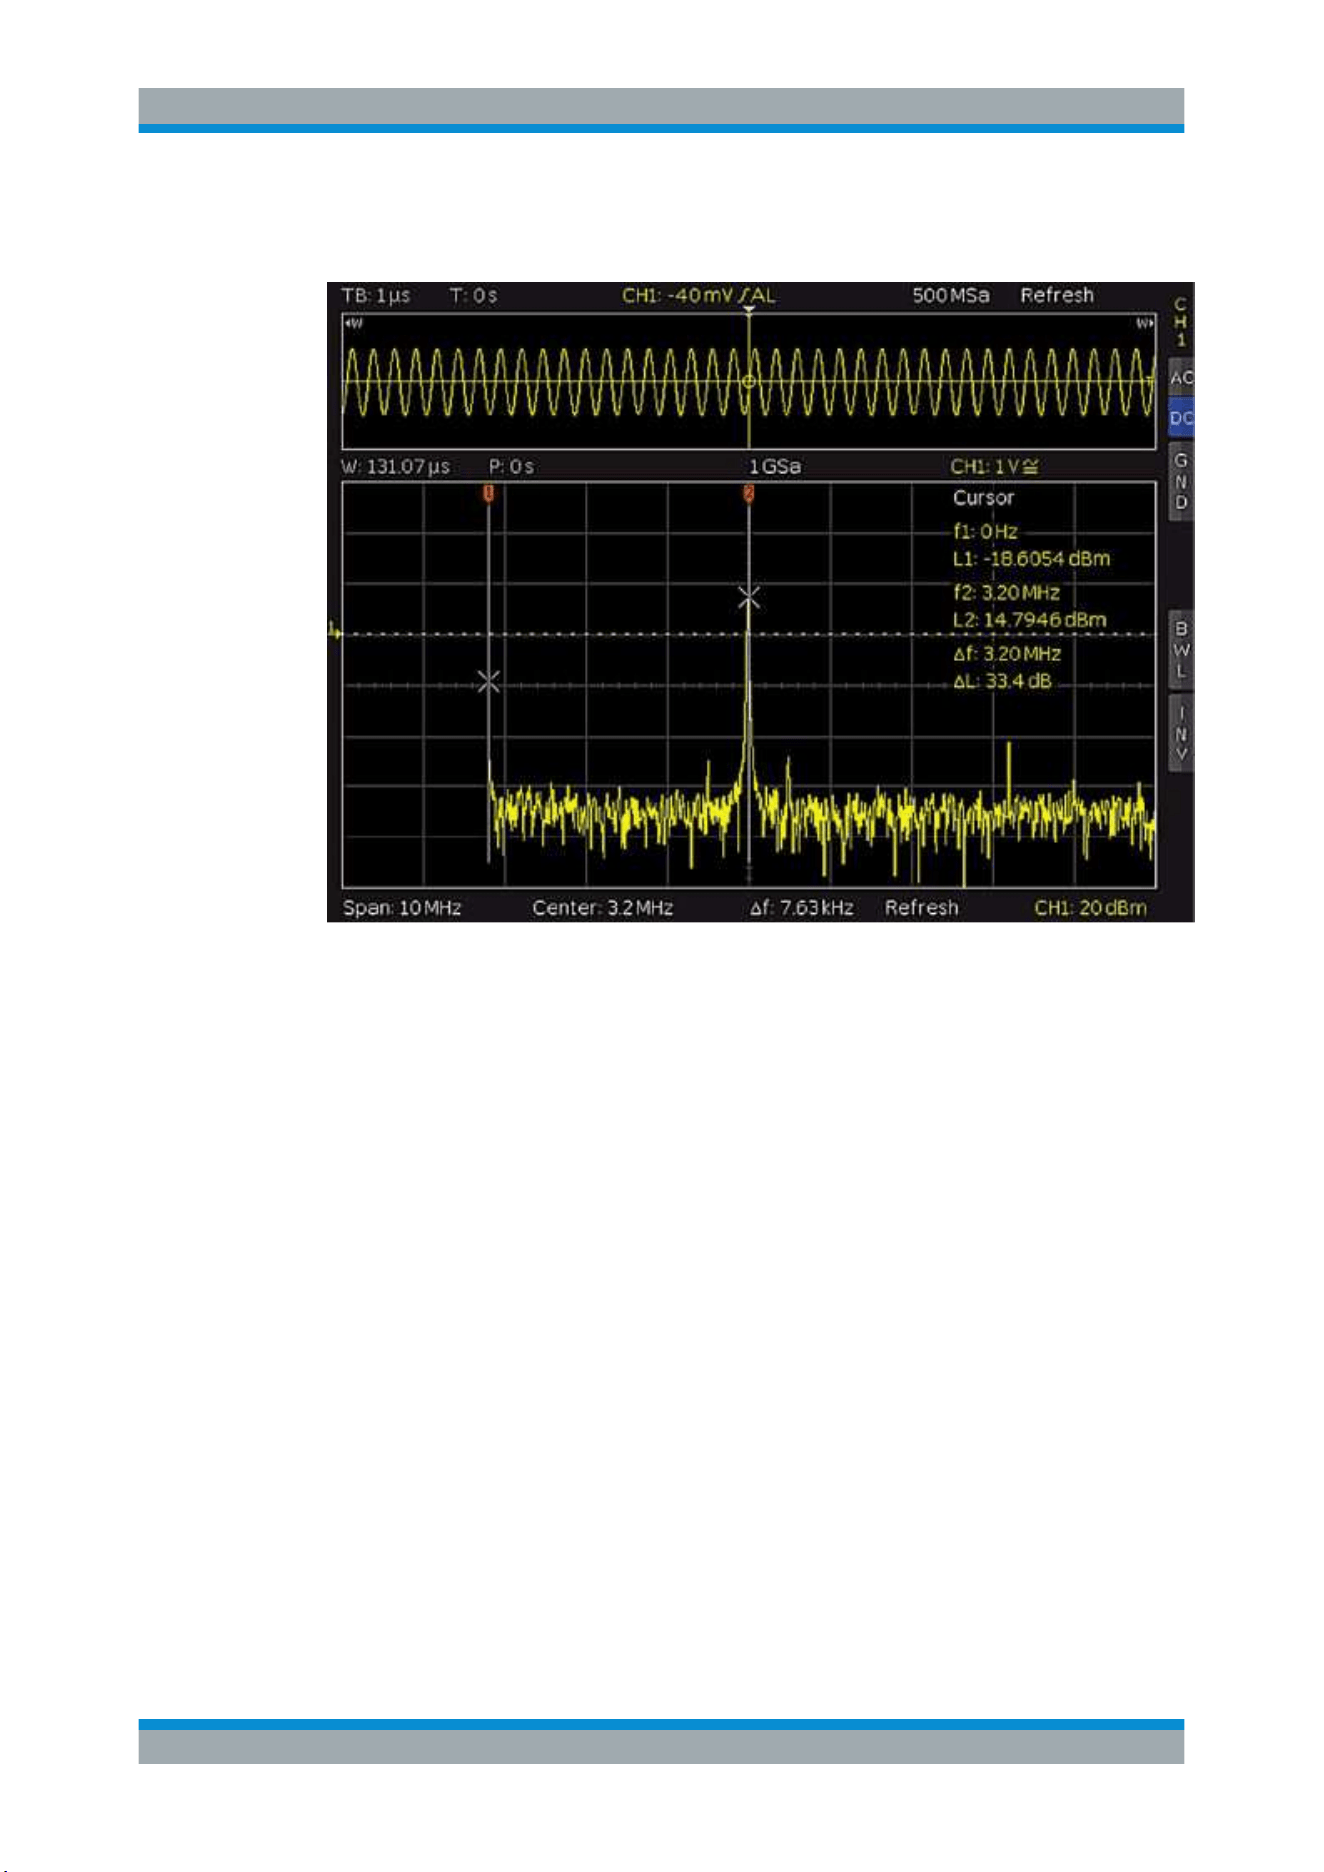
► To start the FFT, press the [FFT] key in the Analysis section
Figure 6-12: FFT
In FFT mode, the screen is divided into two grids:
●
The upper grid shows the voltage vs time waveform. The time domain settings are
shown above the grid, on the left.
●
The area between the upper and the lower grid shows details about zoom and
position.
●
The lower, large grid shows the frequency domain with the most frequent frequen-
cies in the signal and the corresponding amplitudes.
●
The line below the FFT grid indicates the frequency domain settings (span and
center).
If the FFT grid is active, it is outlined in white, and the [Scale] knob in the Horizontal
section changes the span of the FFT. The span is specified in Hz (Hertz) and identifies
the width of the displayed frequency range. The span position is determined by the
center value, which is set using the [Position] knob in the Horizontal section. The dis-
played frequency range is (Center - Span/2) to (Center + Span/2).
The minimum frequency increment depends on the time base. The greater the time
base, the smaller the span. Another important element for the FFT is the setting "Max.
Sampling Rate" in the "ACQUIRE" menu.
► To toggle the settings between time domain, zoom, and frequency domain, press
the [Scale] knob in the Horizontal section.
Frequency Analysis (FFT)
Loading ...
Loading ...
Loading ...