Loading ...
Loading ...
Loading ...
Analysis
R&S
®
RTC1000
62User Manual 1335.7352.02 ─ 04
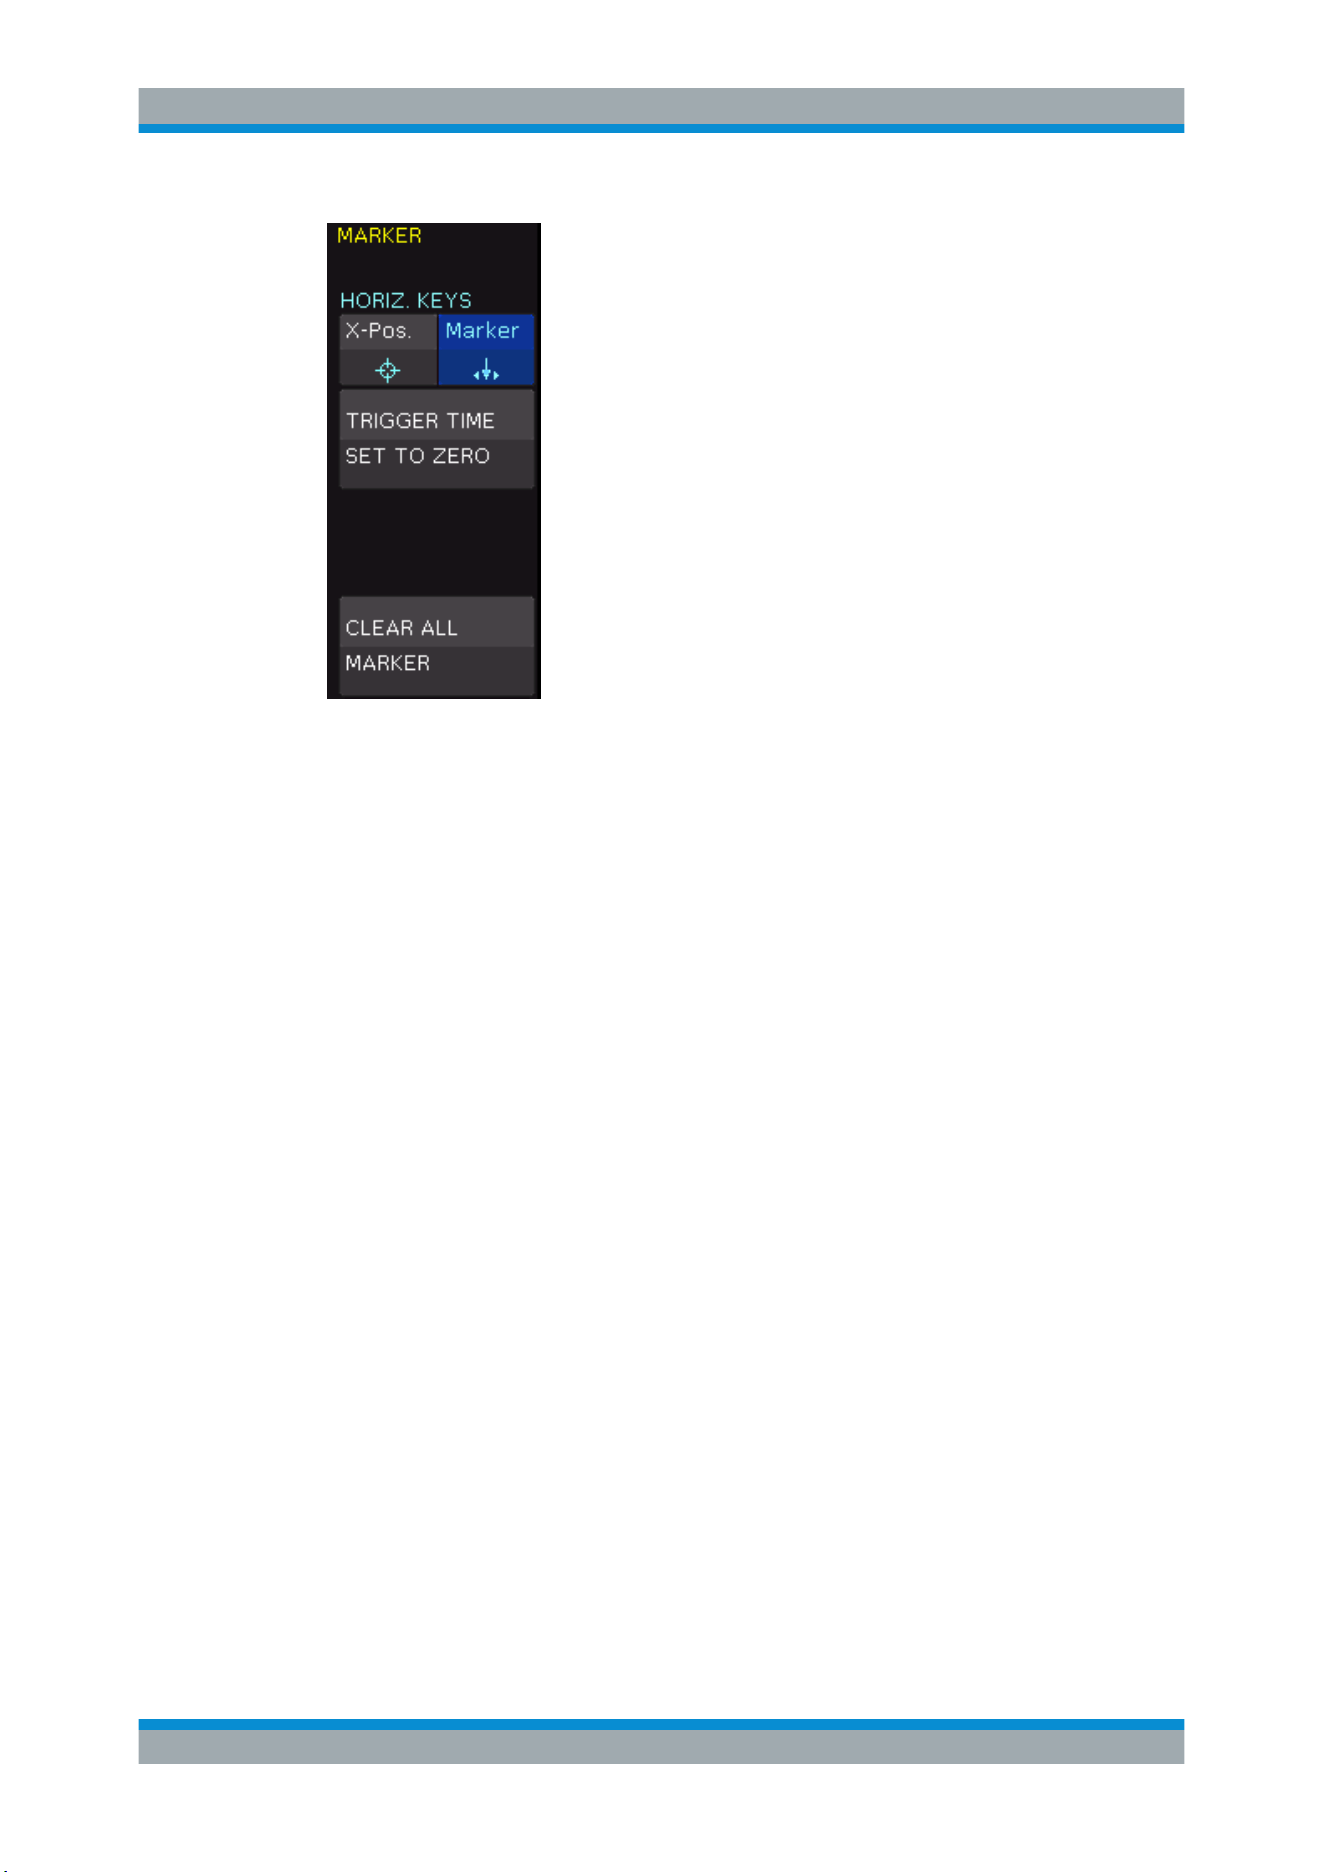
Figure 6-3: Marker menu
TRIGGER TIME SET TO ZERO
Sets the trigger time to 0 s.
CLEAR ALL MARKER
Deletes all defined time markers.
6.3 XY-Display
The XY-display combines the voltage levels of two waveforms in one diagram. The
voltage level of the first signal is displayed in y-direction, and the voltage level of a sec-
ond signal in x-direction. In other words, the time base x is replaced by amplitude val-
ues of a second source.
The resulting XY-display for harmonic signals is known as Lissajous figures. They are
used to analyze frequency and phase position for the two signals, and to measure the
phase shift. If the frequencies are nearly identical, the figure rotates. If the frequencies
are identical, the figure stands still and the phase position can be deduced from its
shape.
1. Activate both analog channels.
2. Press the [UTIL] key in the Vertical section.
3. On menu page 2|2, press "XY".
4. Assign the channels to the axis.
XY-Display
Loading ...
Loading ...
Loading ...