Loading ...
Loading ...
Loading ...
• Jitter Edge
When the measurement item is "TIE" or "Cycle to Cycle", you need to set the
edge of the measurement signal. The edges include Rising, Falling, and Either.
Press Slope, then rotate the multifunction knob to select the desired edge,
and then press down the knob to select it. You can also press Slope continuously
or enable the touch screen to select it.
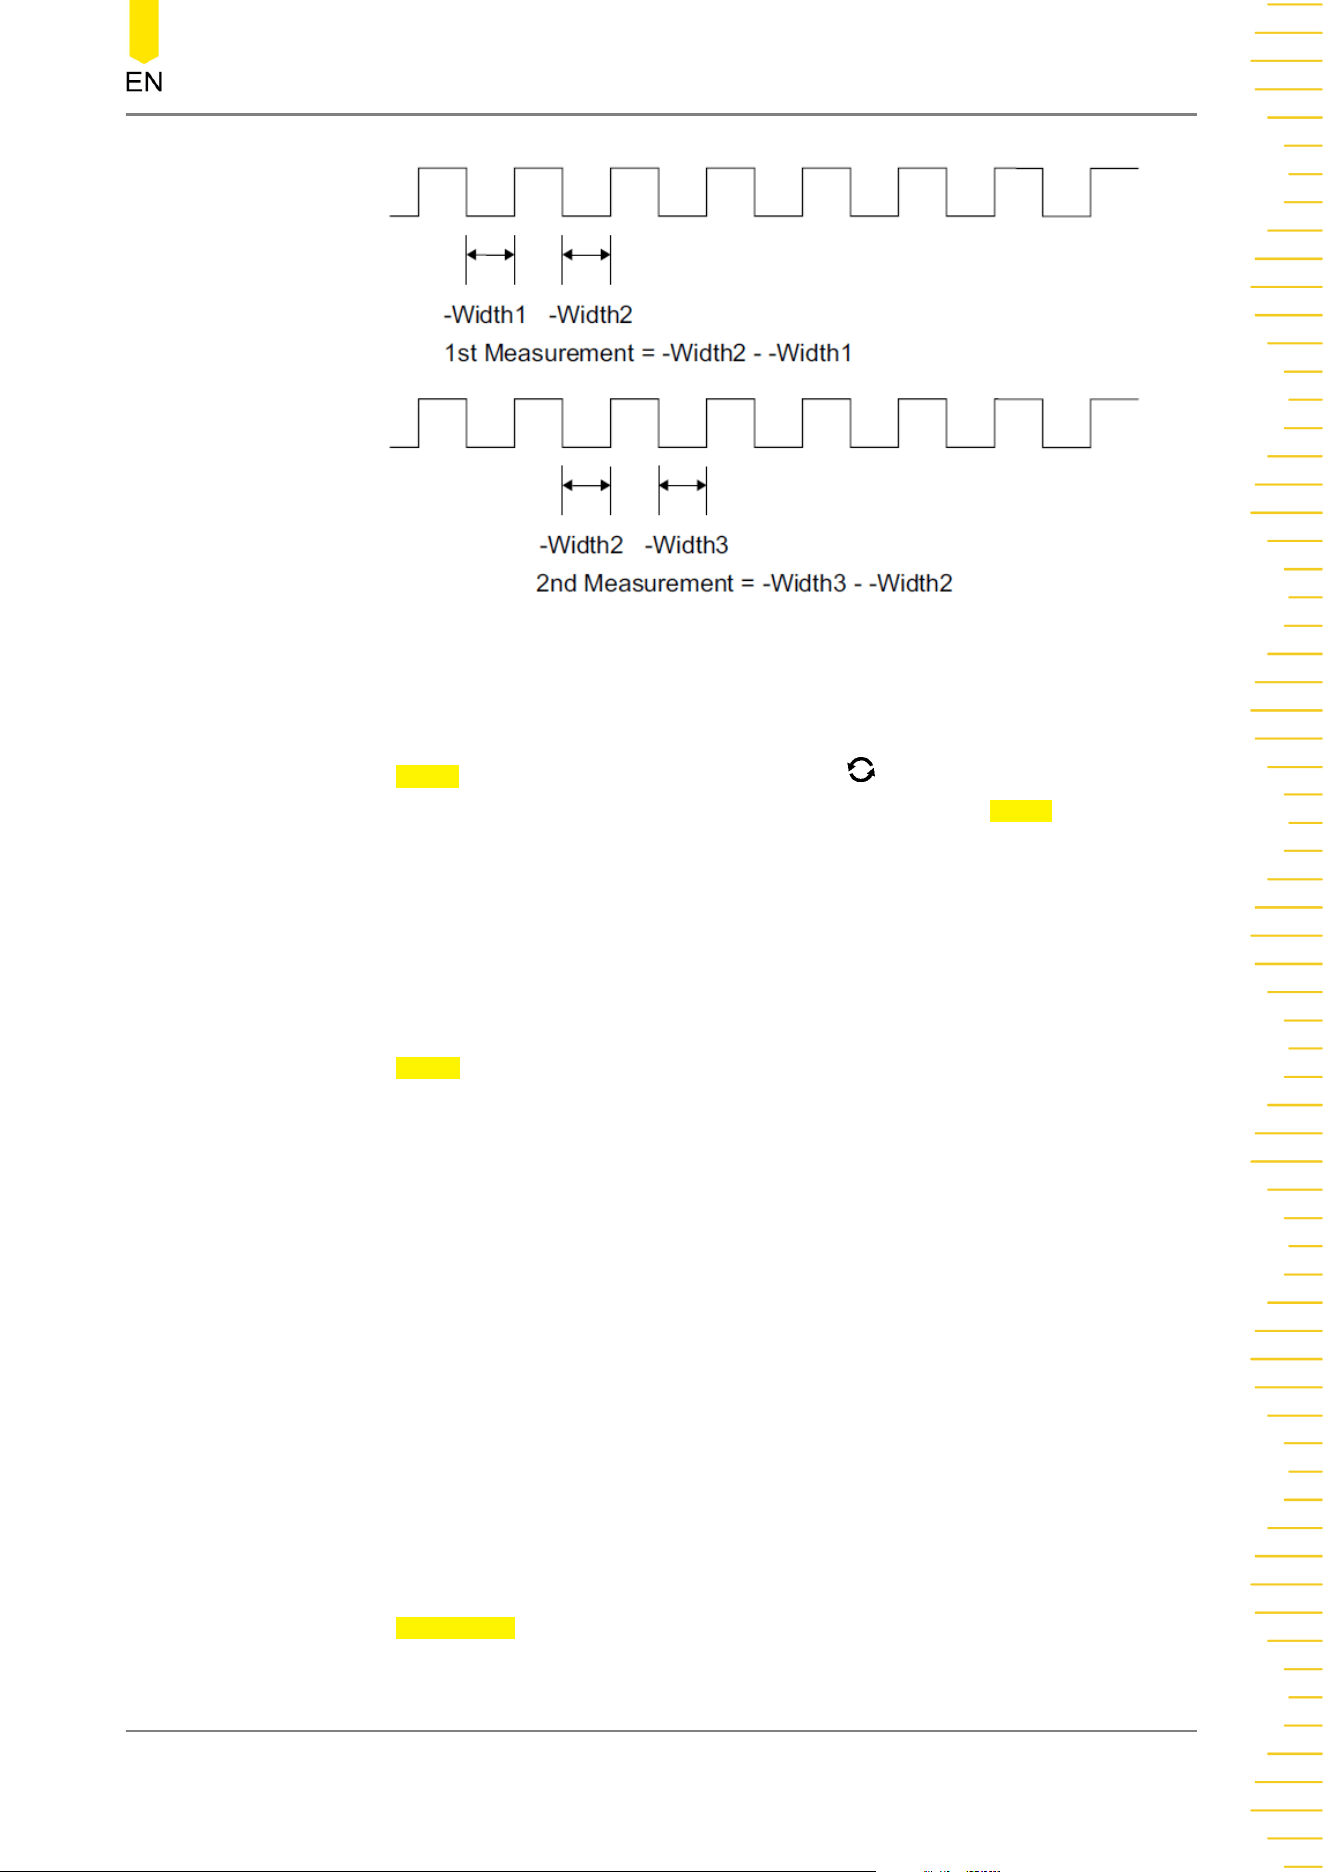
• Jitter Trend Graph
The trend graph can display the trend of the jitter measurement results. The data
obtained from the waveforms of the same frame are generated to form a curve,
which enables users to find out the cause for jitter.
Press
Trend continuously to enable or disable the display of the trend graph.
NOTE
When the clock recovery method is set to "PLL", the PLL system cannot reach the
expected ideal clock frequency until it reaches the specified lock time. During the lock
time, the TIE jitter measurement results based on the ideal recovery clock are incorrect.
The data produced during this time will be discarded in data processing. Therefore, in the
TIE jitter trend graph based on the PLL recovery, part of trend graph at the left section of
the screen will be lost. When a message "Invalid settings" is displayed below the trend
graph, please modify the loop bandwidth, the horizontal timebase, or other related
settings to make valid measurements.
•
Jitter Histogram
The histogram shows the distribution of the jitter measurement results. Gaussian
distributions indicates random jitter, and non-Gaussian distributions indicate the
deterministic jitter.
Press
Histogram continuously to enable or disable the display of the histogram.
NOTE
Real-time Eye Diagram and Jitter Analysis
(Option)
Copyright ©RIGOL TECHNOLOGIES CO., LTD. All rights reserved.
221
Loading ...
Loading ...
Loading ...