Loading ...
Loading ...
Loading ...
SDS6000L User Manual
2 5 4 i n t . s i g l e n t . c o m
Trace Visibility
When multiple output signals are connected, the Bode plot interface will display the amplitude and
phase curves of all output signals at the same time. Users can turn on/off other scanning curves to
observe the details of specific curves. Click Display > Trace Visibility to recall the setting dialog
box.
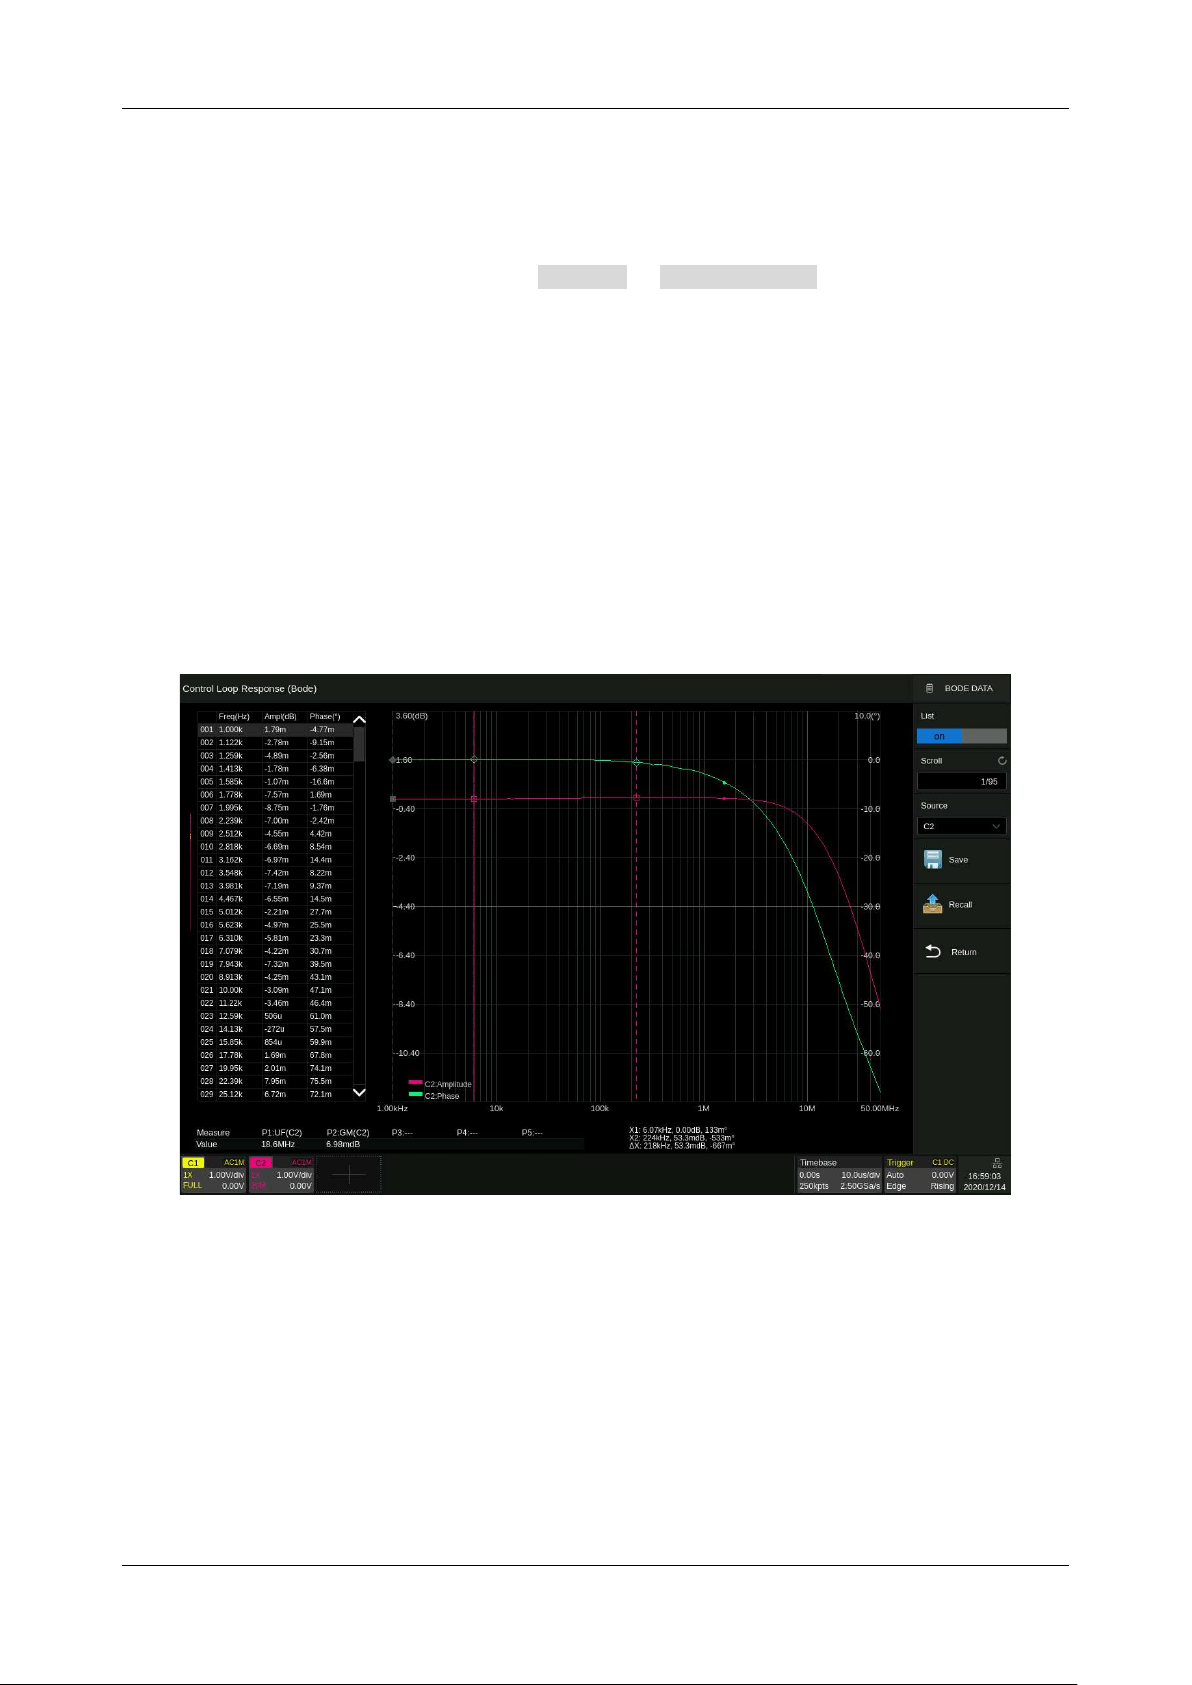
27.4 Data Analysis
With the data list, cursor measurement, and automatic measurement functions, the Bode plot curve
can be analyzed in detail. The data list provides the raw values for each point. The cursors can be
used to flexibly measure the change of each position of the curve. The automatic measurement function
can be used to measure the five parameters of the Bode plot curve: upper cut-off frequency (UF), lower
cut-off frequency (LF), bandwidth (BW), gain margin (GM), and phase margin (PM).
A. Data list display area
B. Cursors
C. Data point location line
D. Cursor information display area
E. Measurement parameters display area
F. Bode plot dialog box
Loading ...
Loading ...
Loading ...