Loading ...
Loading ...
Loading ...
SDS6000L User Manual
int. s i g l e n t . c o m 1 7 5
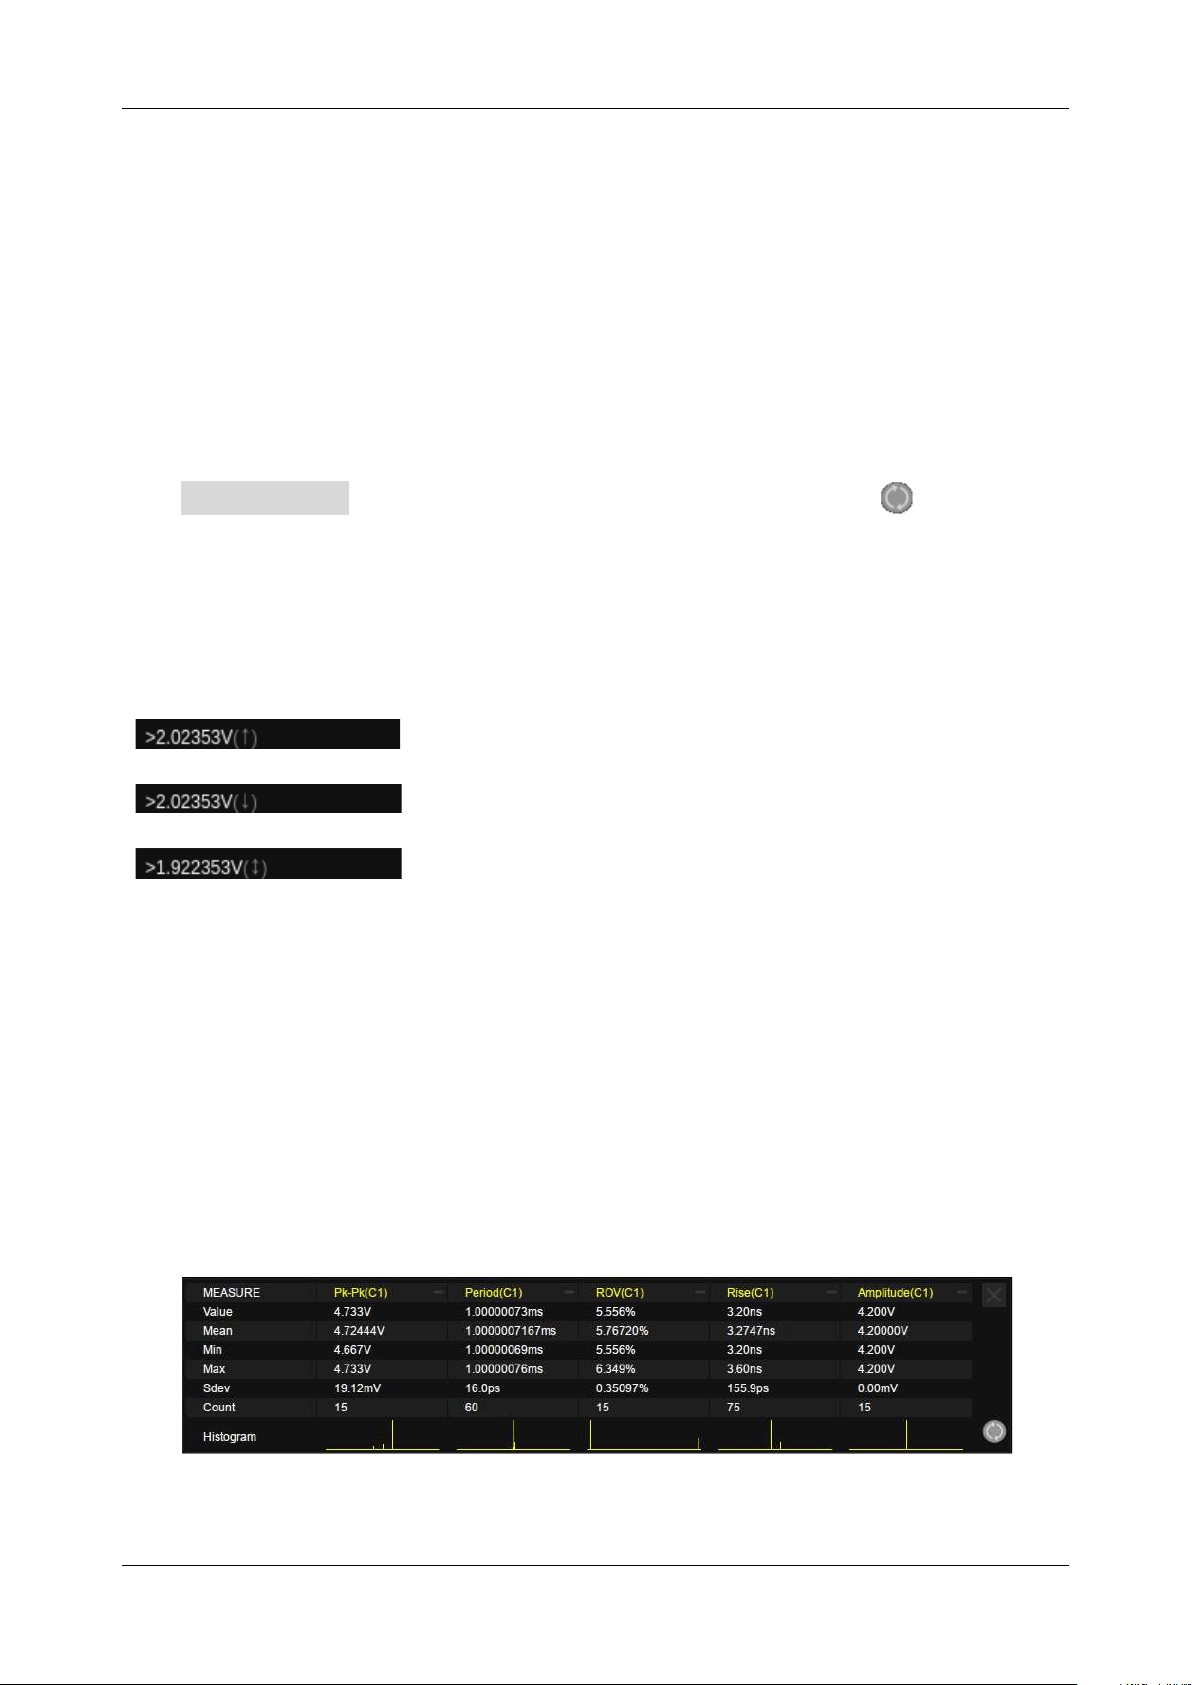
Value –
The current measurement
Mean –
Average of all historical measurements
Min –
The minimum of all historical measurements
Max –
The maximum of all historical measurements
Stdev –
Standard deviation of all historical measurements
Count –
The number of historical measurements
Click Reset Statistics in the statistics setting dialog box, or click the symbol in the statistics
display area to clear and restart statistics.
When the oscilloscope detects the trace under test is clipped, an extra overflow indicator will appear
after the measurement value:
Waveform clipped at the top
Waveform clipped at the bottom
Waveform clipped at both top and bottom
16.8 Statistics Histogram
After enabling statistics on a selected measurement, you can also activate a statistical histogram. The
histogram appears at the bottom of the statistics area. This enables users to quickly view the probability
distribution of the measured parameters. The color of the histogram is consistent with the measurement
source (Channel 1 is yellow, etc.).
Loading ...
Loading ...
Loading ...