Loading ...
Loading ...
Loading ...
SDS6000L User Manual
2 2 0 i n t . s i g l e n t . c o m
DC Mean:
Average of the data
DC RMS:
Root mean square of the data at DC coupling
AC RMS:
Root mean square of the data at AC coupling
Peak-Peak:
Difference between maximum and minimum data value
Amplitude:
Difference between top and base in a bimodal waveform. If not bimodal, the difference
between max and min.
23.3 Diagrams
After selecting the mode, users can click the screen to open the state diagrams: bar, histogram, and
trend. The color of the data in the diagrams is consistent with the color of the source.
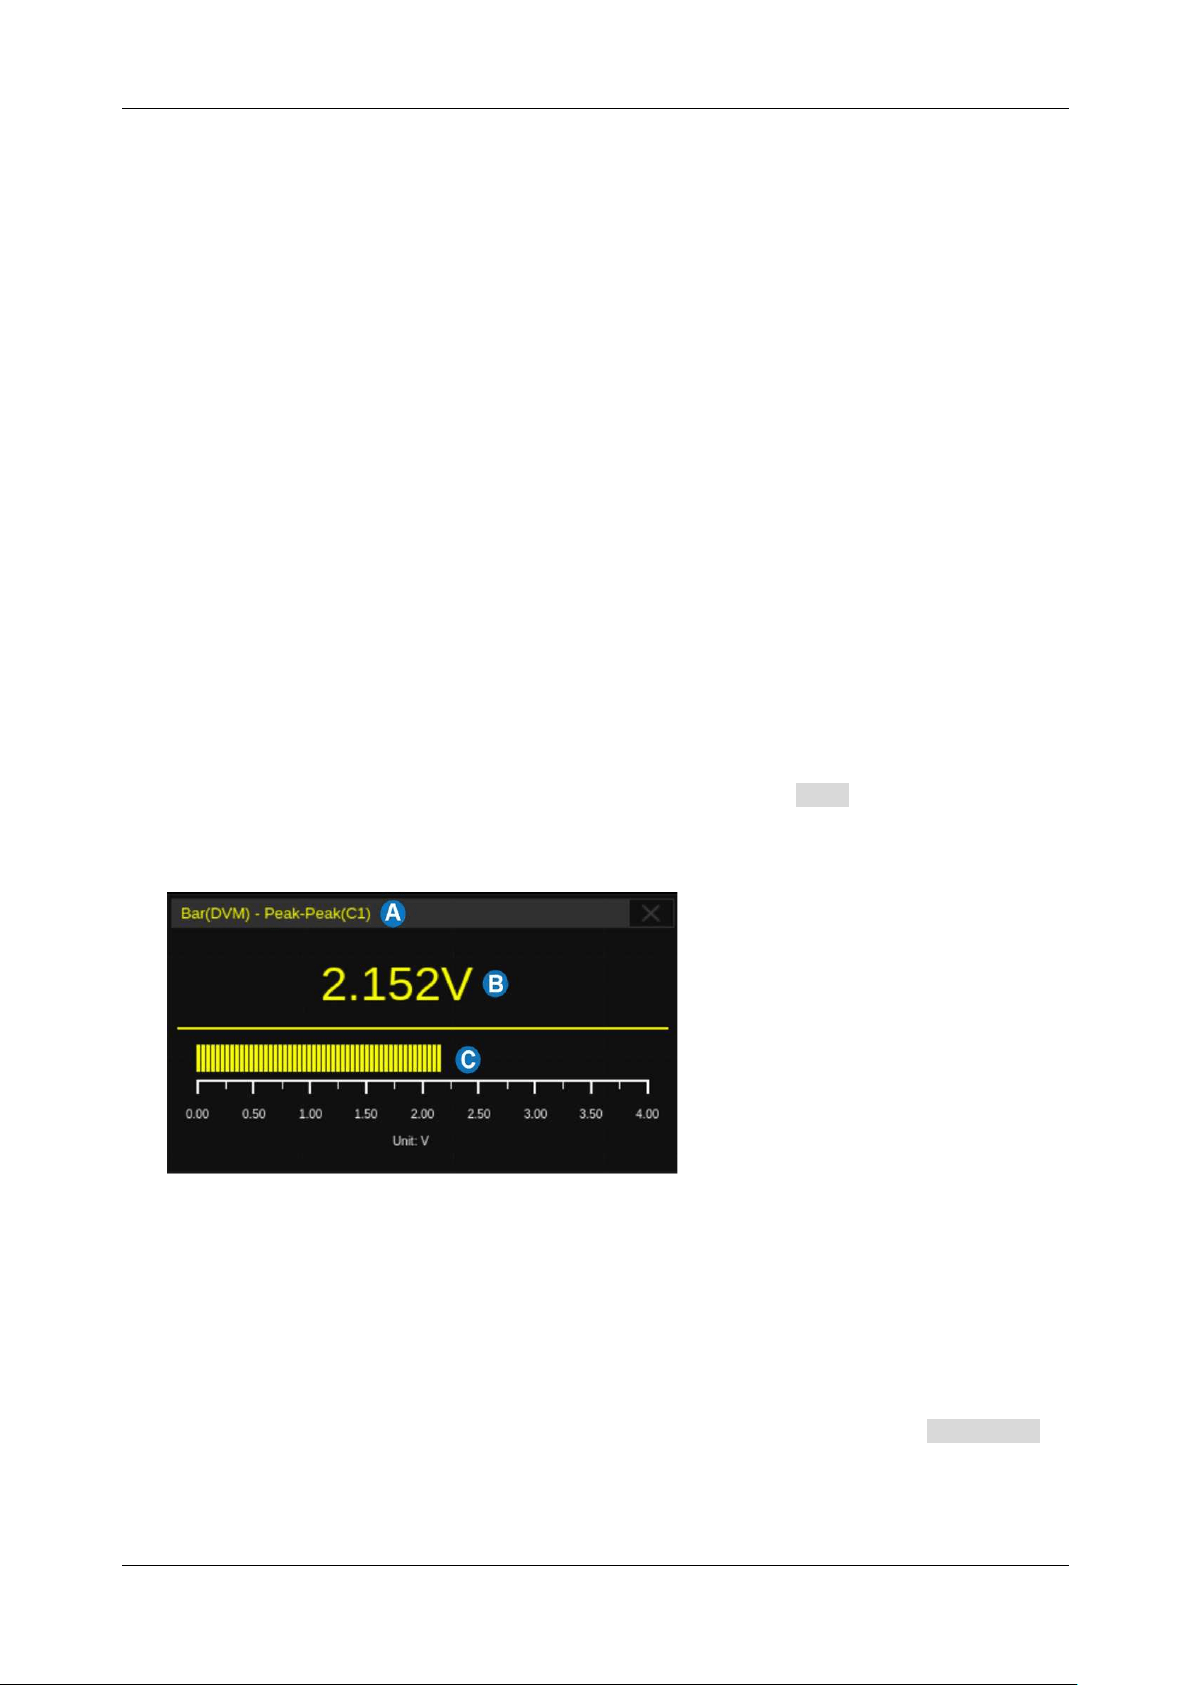
Bar
The bar diagram accurately displays the current measured value. Click Bar in the DVM dialog box
to display it.
A. Mode
B. Current value
C. Bar corresponding to the current value
Histogram
A histogram visually indicates the probability distribution of the measured values. Click histogram in
the DVM dialog box to display it.
Loading ...
Loading ...
Loading ...