Loading ...
Loading ...
Loading ...
DPO6000, MPO6000 Series Digital Fluorescent Oscilloscope Product Manual V1.3
77
Move Cursor: Select the cursor type and turn the multi-function knob V0 to move the
cursor. The cursor can only be moved when the cursor menu is open.
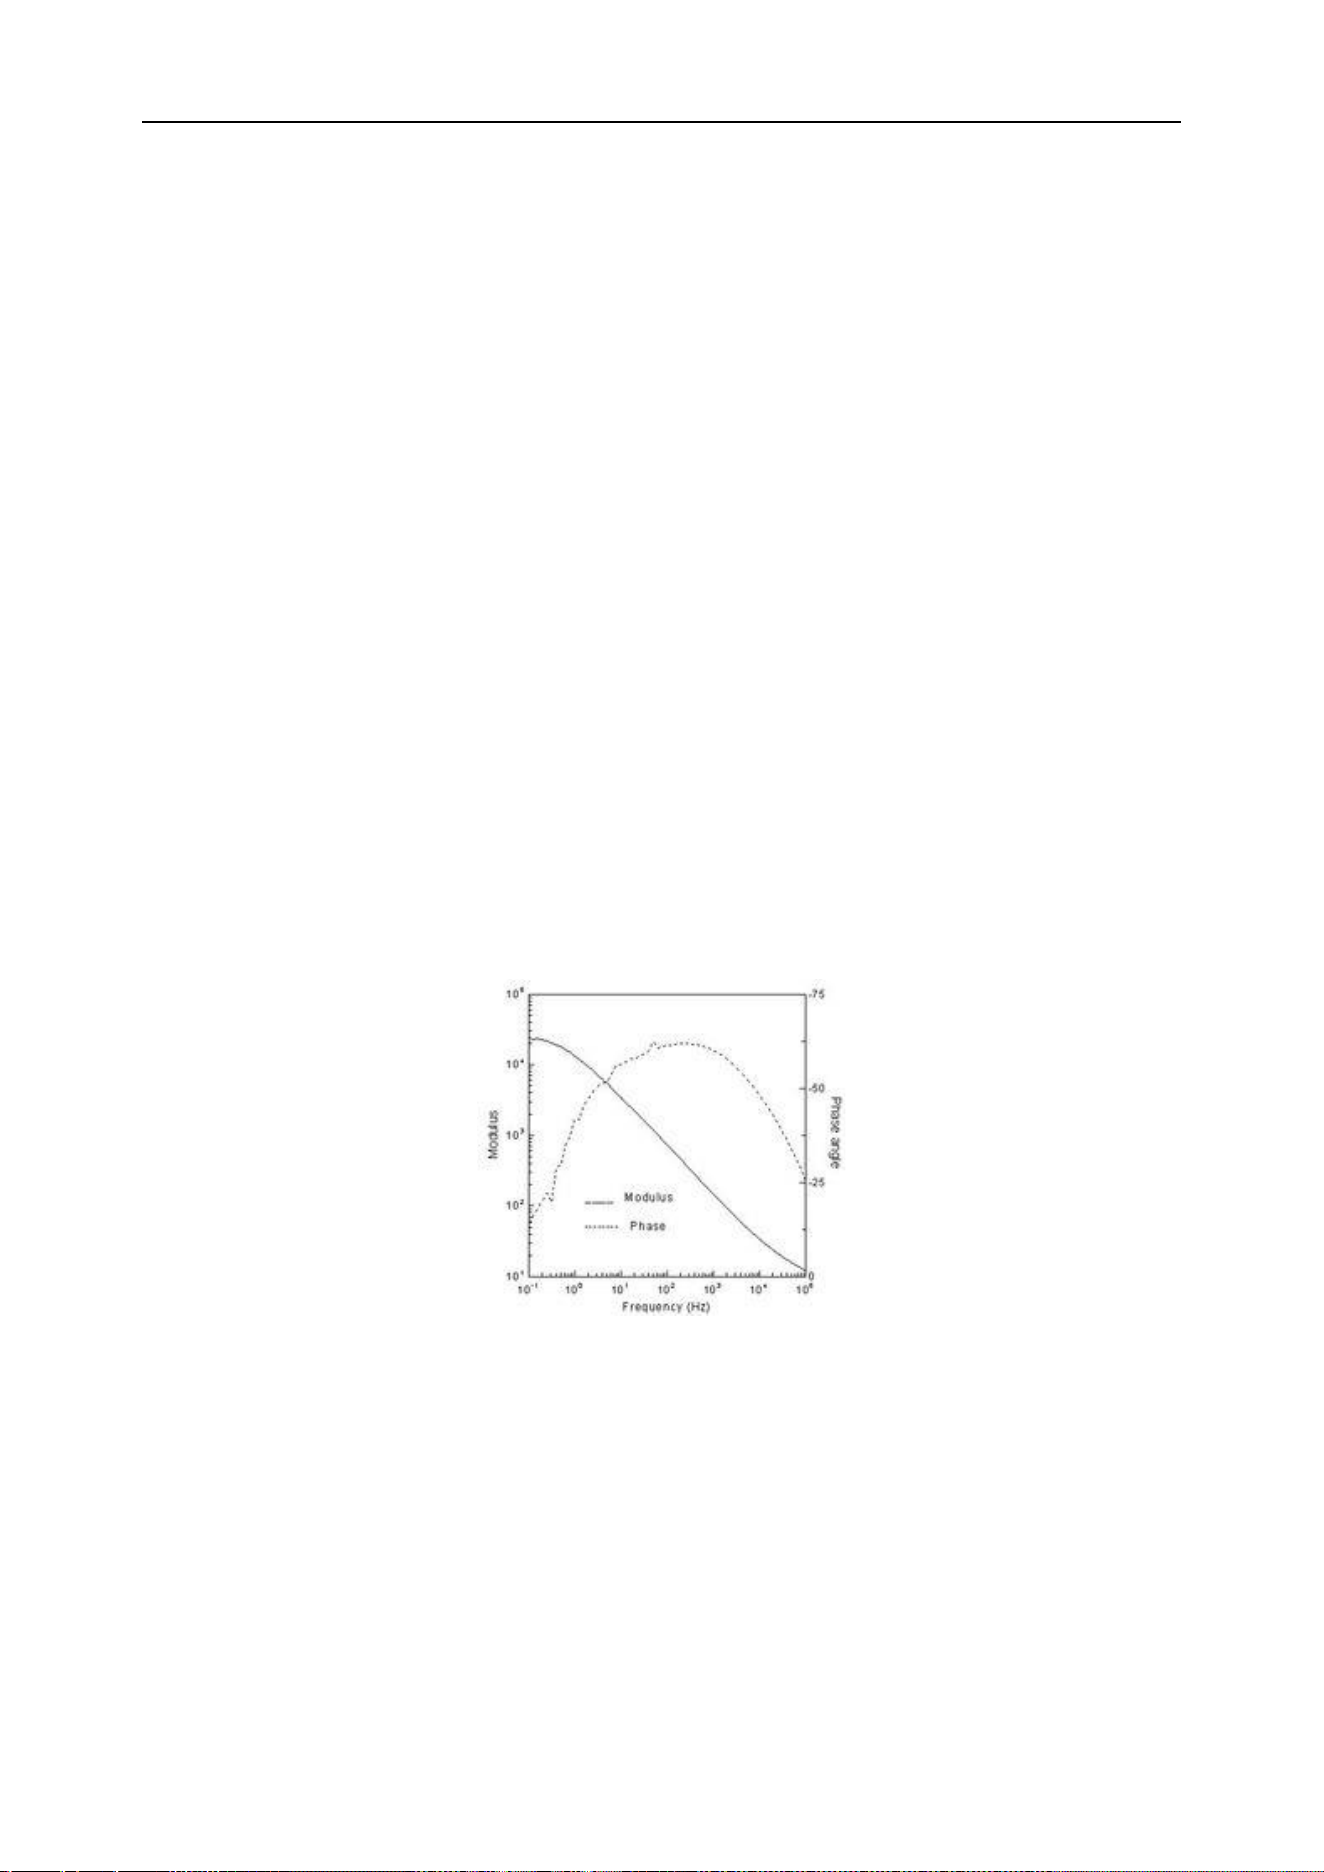
Bode plots (signal source series)
The Bode plots are a semi-logarithmic plot of the transfer function versus frequency of
a linear non-time-varying system. The horizontal axis is frequency and the vertical axis
is expressed on a log scale. The frequency response of the system can be seen using
the Bode plot. The Bode plots are generally composed of two diagrams. One ampli-
tude-frequency diagram represents the change in the decibel value of the frequency
response gain versus frequency, and the other phase-frequency diagram represents
the change in phase versus frequency of the frequency response.
The figure of the Bode plots is related to the system's gain, the number of poles and
zeroes, and the position. As long as the relevant information is known, an approximate
Bode plot can be drawn with simple calculations. This is the advantage of using a Bode
plots.
Bode plots brief
The Bode plots is also called the amplitude frequency response and phase frequency
response curve, which is generally the rectangular coordinate of the amplitude and
phase at the fundamental frequency of the rotating machine relative to the rotor speed.
Bode plots
The logarithmic frequency characteristics are drawn using the method of polyline ap-
proximation when drawing. General drawing of Bode plots:
When drawing a Bode plots, it is performed in three frequency bands. The amplitude-
frequency characteristics are drawn first, in the order of mid-band, low-band, and high-
band. The frequency characteristics (or frequency response) of the three frequency
bands together are the amplitude-frequency characteristics of the entire frequency
band, and then the corresponding phase-frequency characteristics are drawn according
to the amplitude-frequency characteristics.
Loading ...
Loading ...
Loading ...