Loading ...
Loading ...
Loading ...
Operating modes
Provides information about your driving style.
The inf
ormation on driving st
yl
e is only e
v
alu-
ated and displayed when moving forward.
∅ ECO points: indication on driving style
Indicates driving style efficiency since start
on a scale of 0 to 100. The higher the value
displayed, the more efficient the driving style.
Press on the display for more information.
Statistics are shown for the last 30 minutes of
driving from the start. If 30 minutes have not
elapsed, the values of the last trip are shown
in grey.
∅ l/100 km: Average fuel consumption
Shows the average fuel consumption. The
value is calculated using the kilometres trav-
elled since start as a reference. Press on the
display for more information. Statistics are
shown for the last 30 minutes of driving from
the start. If 30 minutes have not elapsed, the
values of the last trip are shown in grey.
Eco tips: Tips on how to save fuel
Press the ECO tips
button to get advice on
ho
w t
o sav
e fuel. These tips can only be con-
sult
ed whil
e the vehicle is stopped.
Efficient driving style assessment
The representation uses different elements to
show driving style efficiency.
Indication
›››
Fig. 220: Meaning
1
To the left of the columns are different symbols
that provide information about the current driv-
ing st
yle
›››
table on page 229.
2
The white column is an indication of where the
efficiency graph starts (from left to right).
It shows the position of the evaluation that is
currently being performed.
3
Bars to illustrate acceleration.
The position of the car represents acceleration.
If the speed is const
ant, the car remains in the
central zone. If it accelerates or brakes, the car
moves backwards or forwards respectively.
4
Columns representing driving style efficiency.
Horizontally, the columns represent r
etrospec-
tive driving efficiency, and move from left to
right approximately every 5 seconds. The high-
er the columns, the more efficient the driving
style.
The colour of the sky represents the average of
the last 3 minutes. The colour changes from
grey (less efficient) to blue (more efficient).
Symbols
›››
Fig. 221: Meaning
A
Thinking ahead. Sudden changes in accelera-
tion lower the efficiency of the driving styl
e.
B
Gear recommendation.
C
Current speed has a negative impact on fuel
consumption.
D
Ecological driving style.
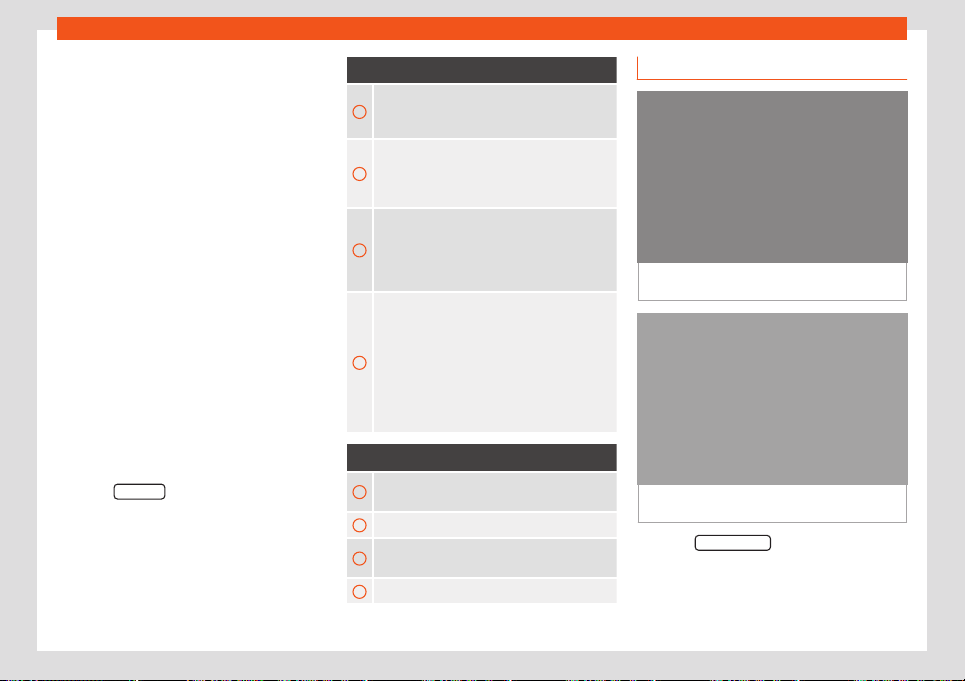
Vehicle status
Fig. 222
Standard representation: vehicle sta-
t
us.
Fig. 223 Standard representation: vehicle sta-
t
us.
Press the V
ehicl
e st
at
us button to access infor-
mation on the Vehicle status messages
and Start-Stop system.
»
229
Loading ...
Loading ...
Loading ...