Loading ...
Loading ...
Loading ...
Instrument Functions
R&S
®
NGL200/NGM200
78User Manual 1178.8736.02 ─ 09
CSV settings Selective fields in the dialog
"Error Designator" "IEE Float (NaN)", "Empty"
"Line End Marker" "CR/LF", "LF"
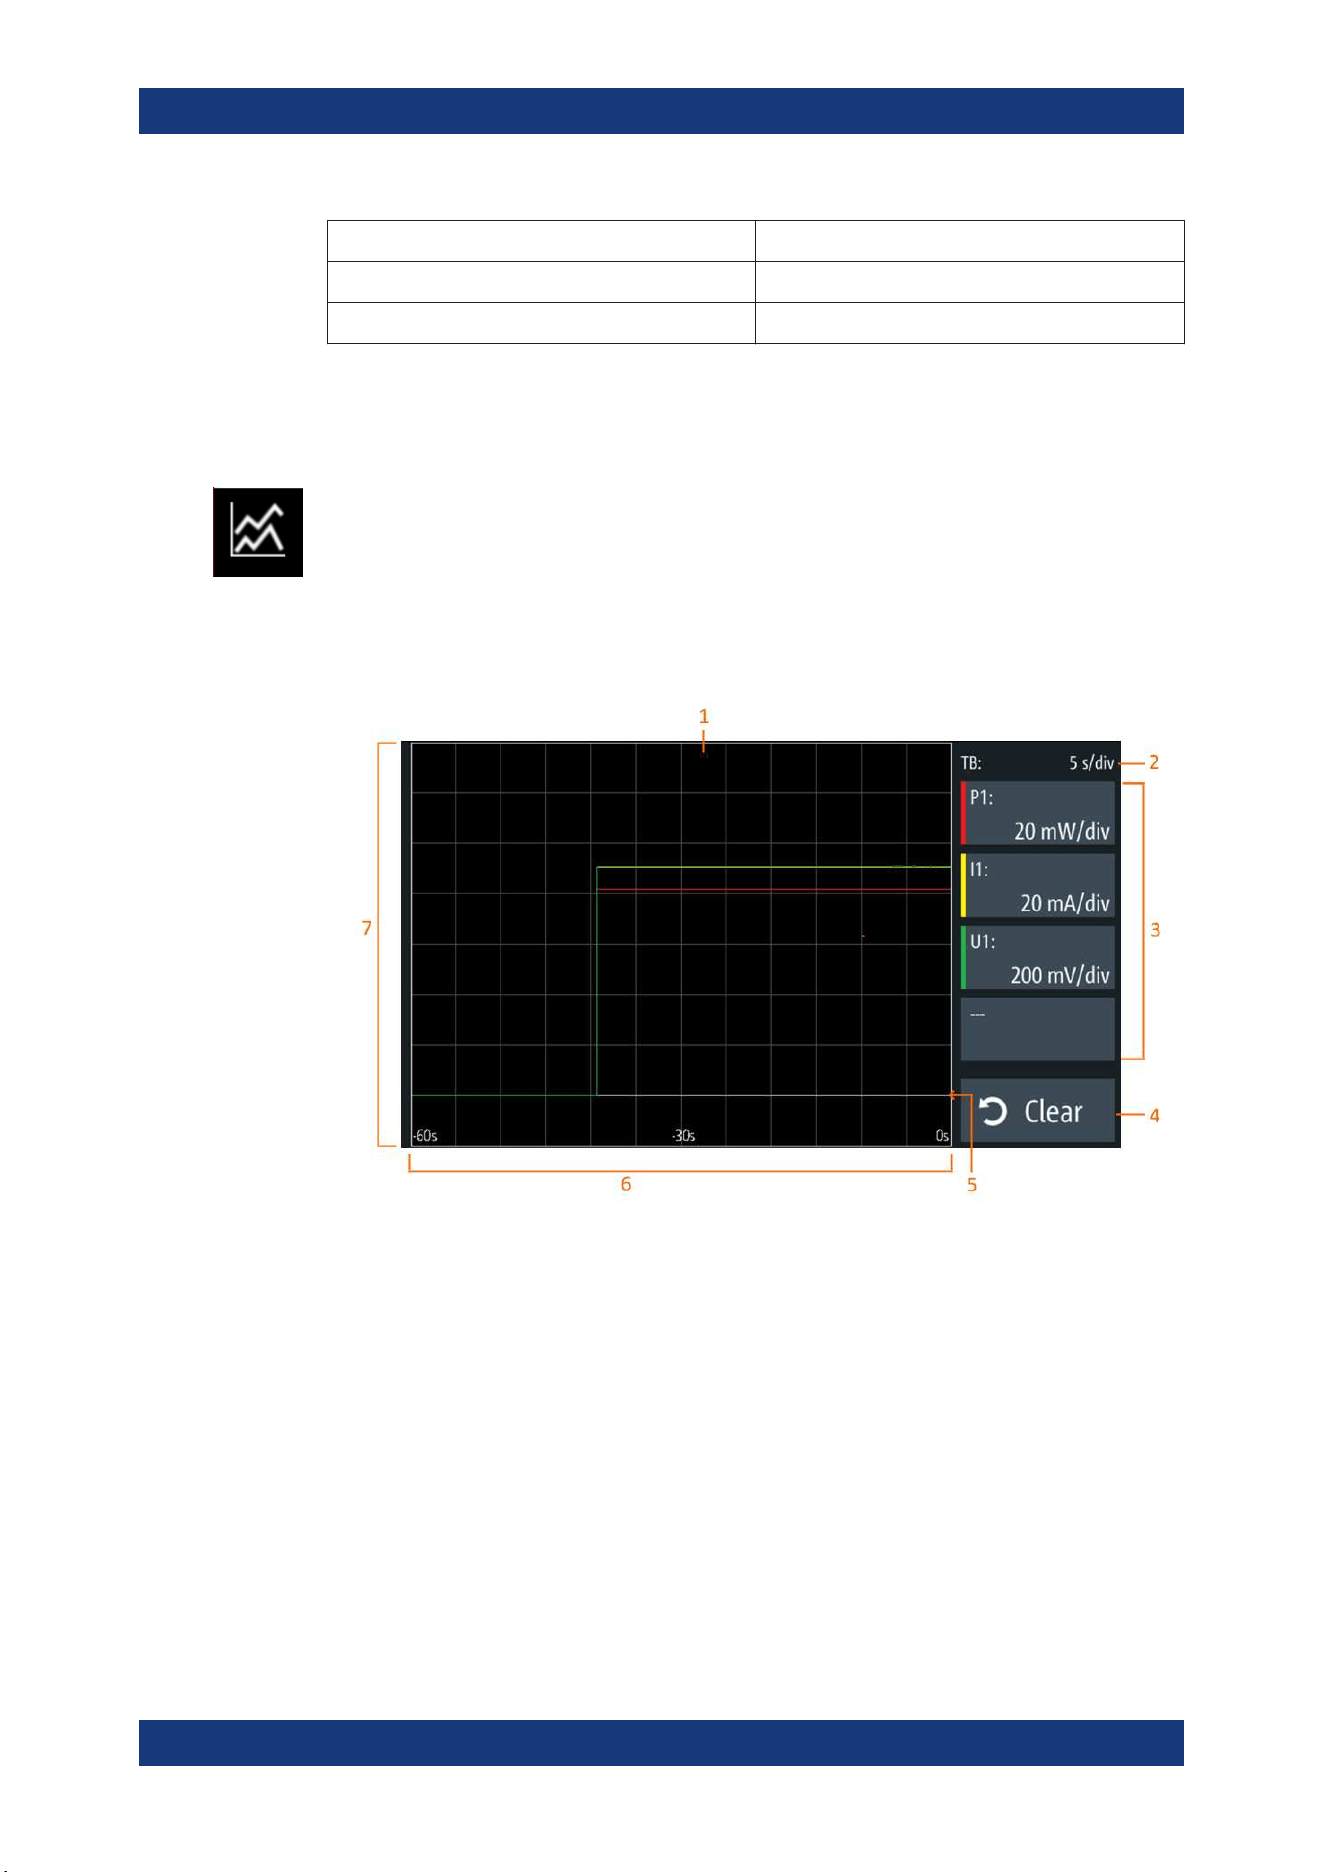
6.13 Graphical View Window
The graphical view measurement is a time-based measurement that allows you to vis-
ualize measurements on available data sources.
The graph illustrated below shows the output of voltage "U1" 0.9 V, current "I1" 90 mA
at channel 1 with output power of "P1" 81 mW from 39 seconds ago. Each measure-
ment trace is represented with an individual color.
The time-based scale is fixed with a time duration display up to the last 60 seconds.
Figure 6-31: Graphical view window
1 = Display window for measurement
2 = Time axis scale fixed at 5 s/div
3 = Configuration slot for measurement
4 = Reset measurements in display window
5 = Zero-origin of the graph
6 = Time axis
7 = Measurement axis
1. Long-press on the [Settings] key or the "Settings" button in
Chapter 5.1.2, "Chan-
nel Display Area"
, on page 32.
The R&S NGL/NGM displays the graphical view window. See Figure 6-31.
2. Alternatively, press [Settings] > device menu > "Graphical View" to access graphi-
cal view window.
Graphical View Window
Loading ...
Loading ...
Loading ...