Loading ...
Loading ...
Loading ...
SIGLENT
108 User Manual
be achieved.
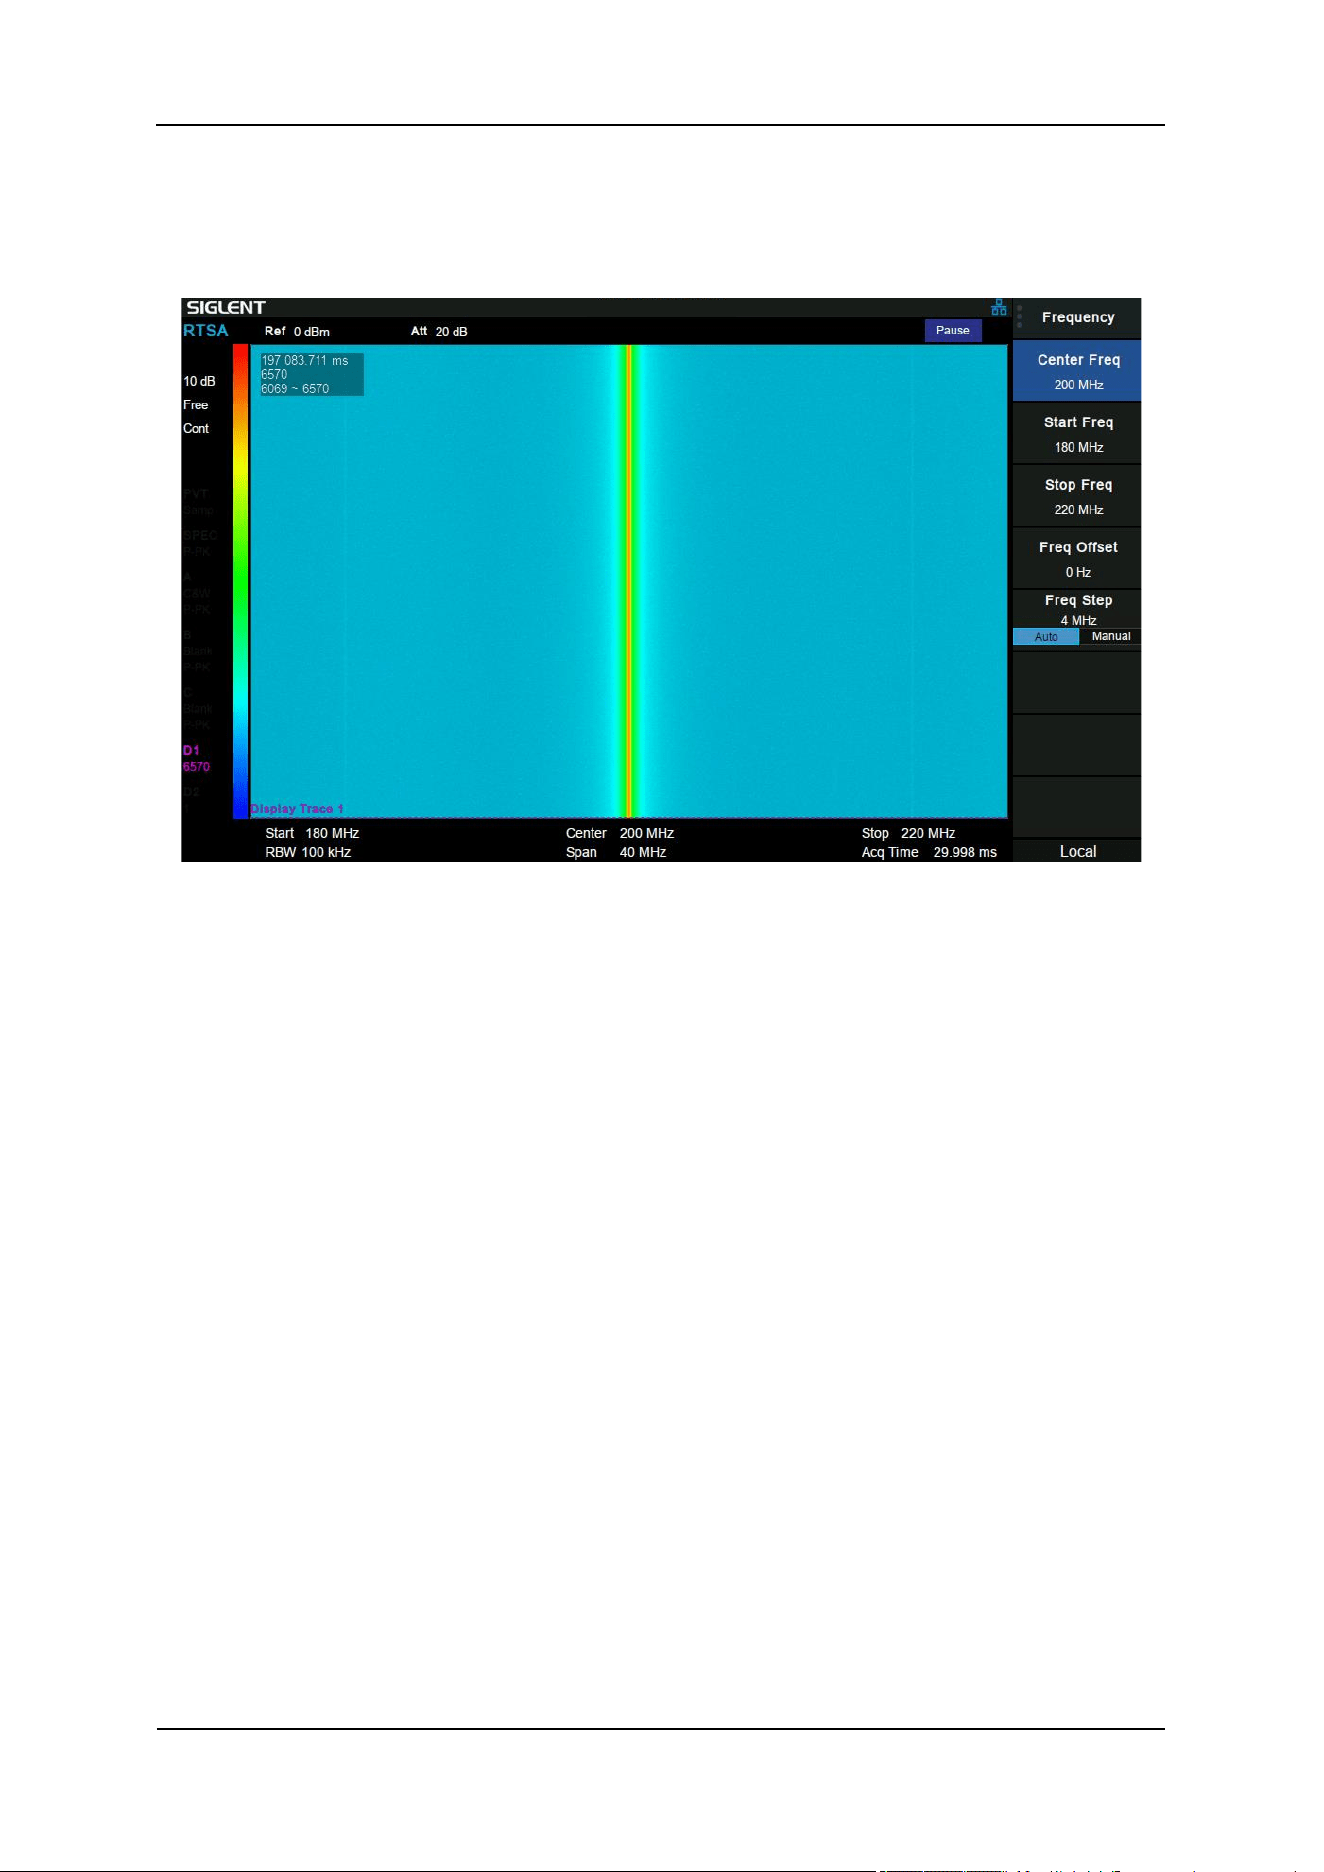
6.4.1.2 Spectrogram
Figure 6-2 Spectrogram
In the “Spectrogram” display, the same spectral data is shown with a time dimension added to the
spectrum display. “Spectrogram” records the relationship between the frequency-domain characteristics
of each event and time.
In this view, the X axis represents frequency, the Y axis represents time, and the colour represents signal
amplitude.
The information area in the upper left corner of the “Spectrogram” display shows the real-time of the
latest spectral data (relative to the start measurement), the total number of generated waveform frames,
and the waveform display range.
In the "paused" state, the user can observe the historical trace by moving display trace (D1, D2), or the
historical range of the waveform data displayed in the waveform area by view start and view end. In the
run state, the view interval offset is 0 by default, that is, the latest historical data is displayed, while D1
and D2 are the latest trace by default.
Reading makers on traces D1 and D2, observe the position (time of occurrence) of the corresponding
traces in the historical data, as well as the frequency and amplitude of signals. Compared with the latest
trace, it can trace up to 50000 frames in the future. When the total number of generated waveforms is
more than 50000 frames, the historical data of more than 50000 frames will be discarded.
Loading ...
Loading ...
Loading ...