
Loading ...
Loading ...
Loading ...
172
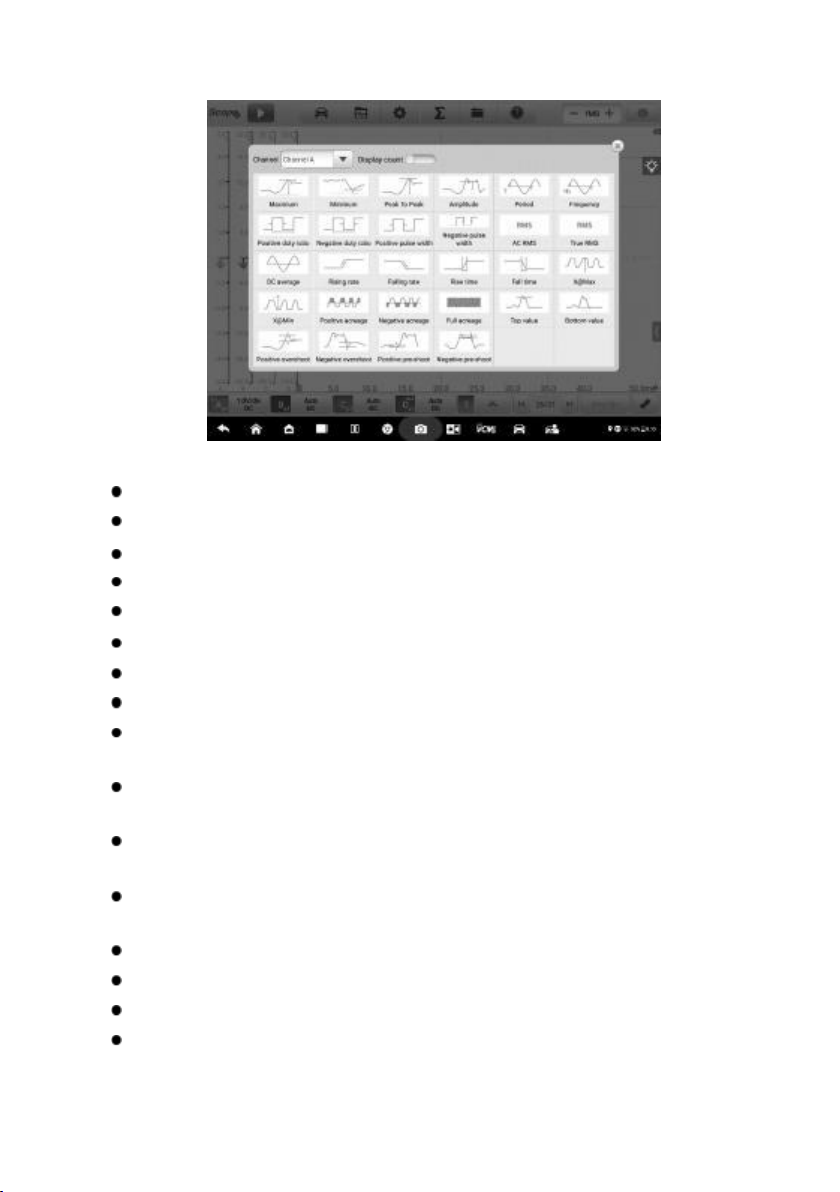
Figure 9-63 Measurement Screen 1
Maximum — the highest level that the signal reaches
Minimum — the lowest level that the signal reaches
Peak To Peak — the difference between maximum and minimum
Amplitude — the top value minus the bottom value
Period — the duration of one cycle in a repeated pattern in the waveform
Frequency — the number of signal occurrences per second
Positive Duty Ratio — the ratio of positive pulse width to period width
Negative Duty Ratio — the ratio of negative pulse width to period width
Positive Pulse Width — the amount of time that the signal spends above its
average value
Negative Pulse Width — the amount of time that the signal spends below its
average value
AC RMS — the root mean square (RMS) value of the waveform minus the DC
Average
True RMS — the root mean square (RMS) value of the waveform, including
the DC component
DC Average — the average value of the waveform
Rising Rate — the rate at which the signal level rises
Falling Rate — the rate at which the signal level falls
Rise Time — the time the signal takes to rise from the lower threshold to the
Loading ...
Loading ...
Loading ...