Loading ...
Loading ...
Loading ...
SDS2000X HD Series Digital Oscilloscope User Manual
2 4 8 i n t . s i g l e n t . c o m
28 Bode Plot
Overview
The SDS2000X HD supports an automatic Bode plot function. This function provides a frequency
response curve of the device-under-test as well as the interface for output sweep parameter control
and data display settings. At this time, either the SIGLENT SAG1021I arbitrary waveform generator
or one of a SIGLENT SDG series arbitrary function generators are supported. During the sweep, the
oscilloscope configures the generator output frequency and amplitude and then compares the input
signal to the output of the DUT. Gain (G) and phase (P) are measured at each frequency and plotted
on the frequency response Bode plot. When the loop response analysis is complete, you can move
the markers on the chart to see the gain and phase values measured at each frequency point. You
can also adjust the scale and offset settings for the amplitude and phase plots.
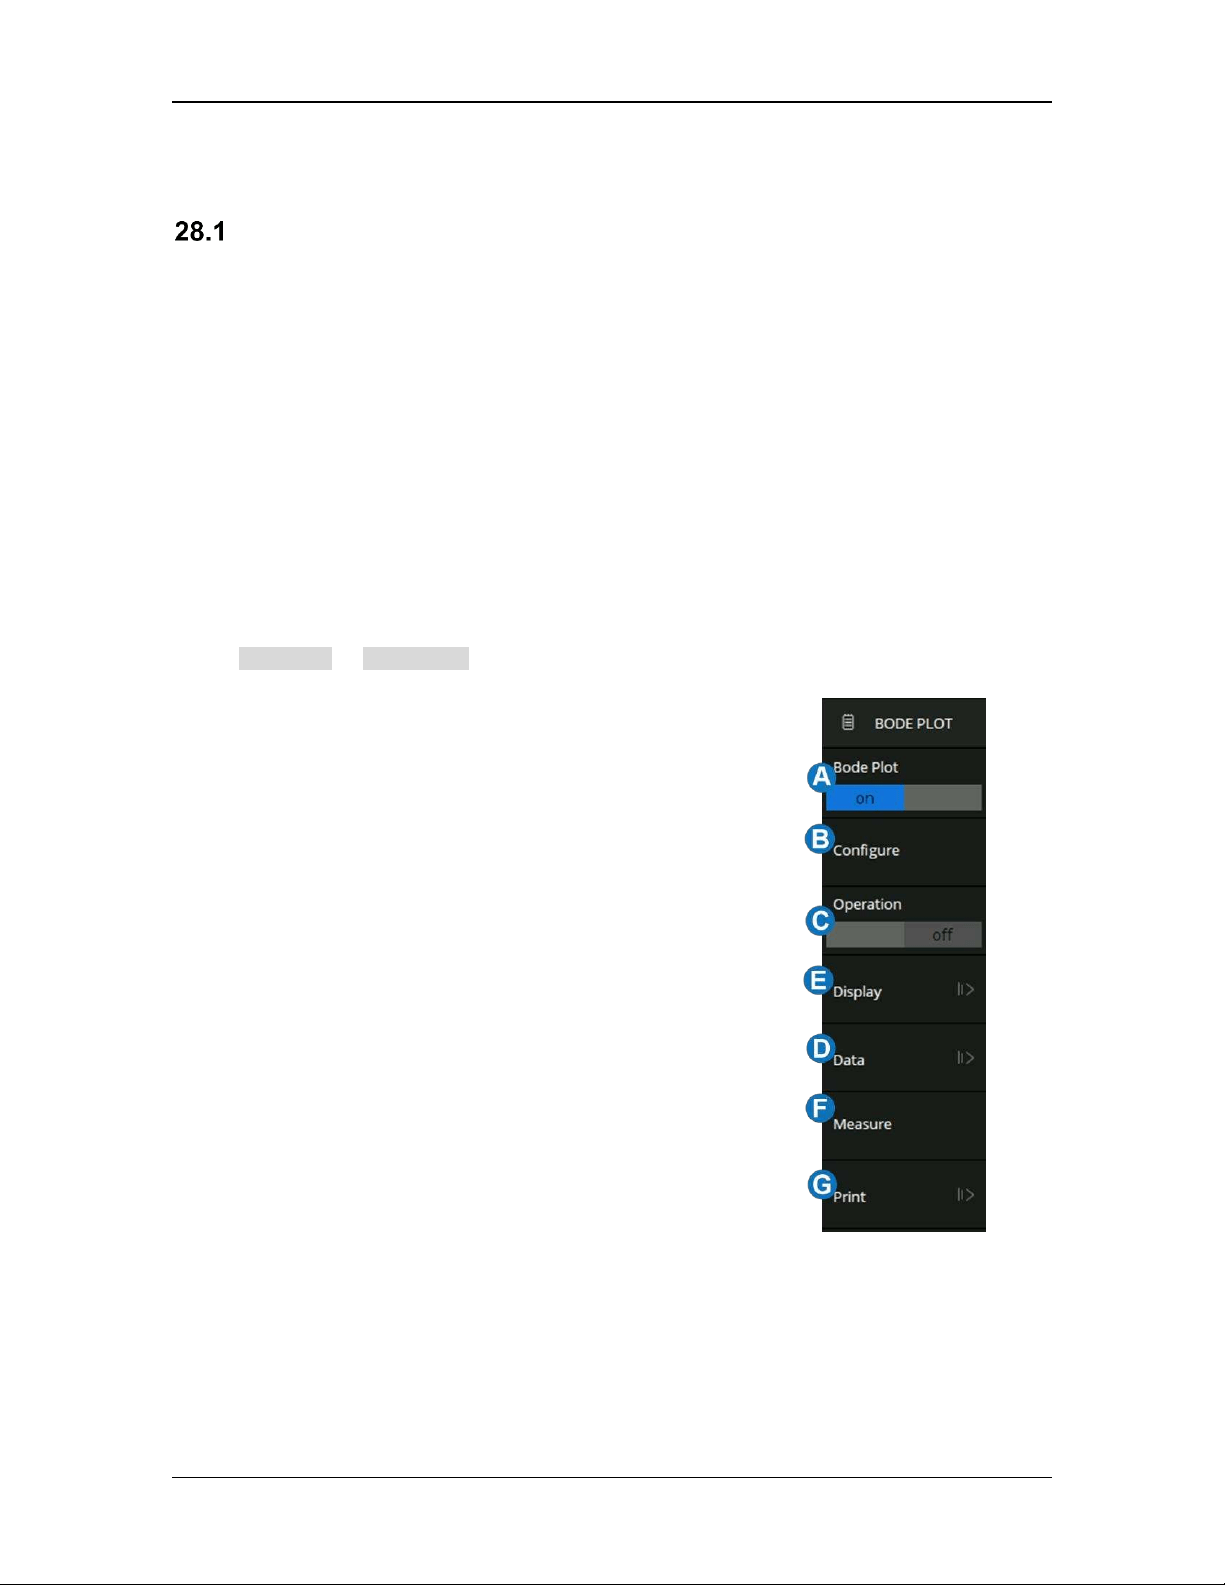
Touch Analysis > Bode Plot to recall Bode plot dialog box:
A. Turn on/off the Bode plot
B. Configure the Bode plot (DUT, AWG connection, sweep
parameters)
C. Turn on/off the operation
D. Set display parameters, including coordinate axis, trace
visibility, and cursors
E. Data list. Open the data list of the Bode plot to view the
curve data, save the data results to a U-disk or recall it
from a U-disk
F. Set the measurement parameters. Parameter
measurement of scanning curve includes upper cut-off
frequency (UF), lower cut-off frequency (LF), bandwidth
(BW), gain margin (GM), and phase margin (PM)
G. Quickly print the specified Bode Plot waveform area to the
storage
Loading ...
Loading ...
Loading ...