Loading ...
Loading ...
Loading ...
31
Figure 4-15 Sample Display Mode Screen
Each parameter item displays the selected mode independently.
Analog Gauge Mode — displays the parameters in gauge charts.
Text Mode — the default mode that displays the parameters as a text list.
NOTE
Status parameters, such as a switch reading like ON, OFF, TRUE, and FALSE can only
be displayed in Text Mode. Value parameters, such as a sensor reading, can be
displayed in both text and graph mode.
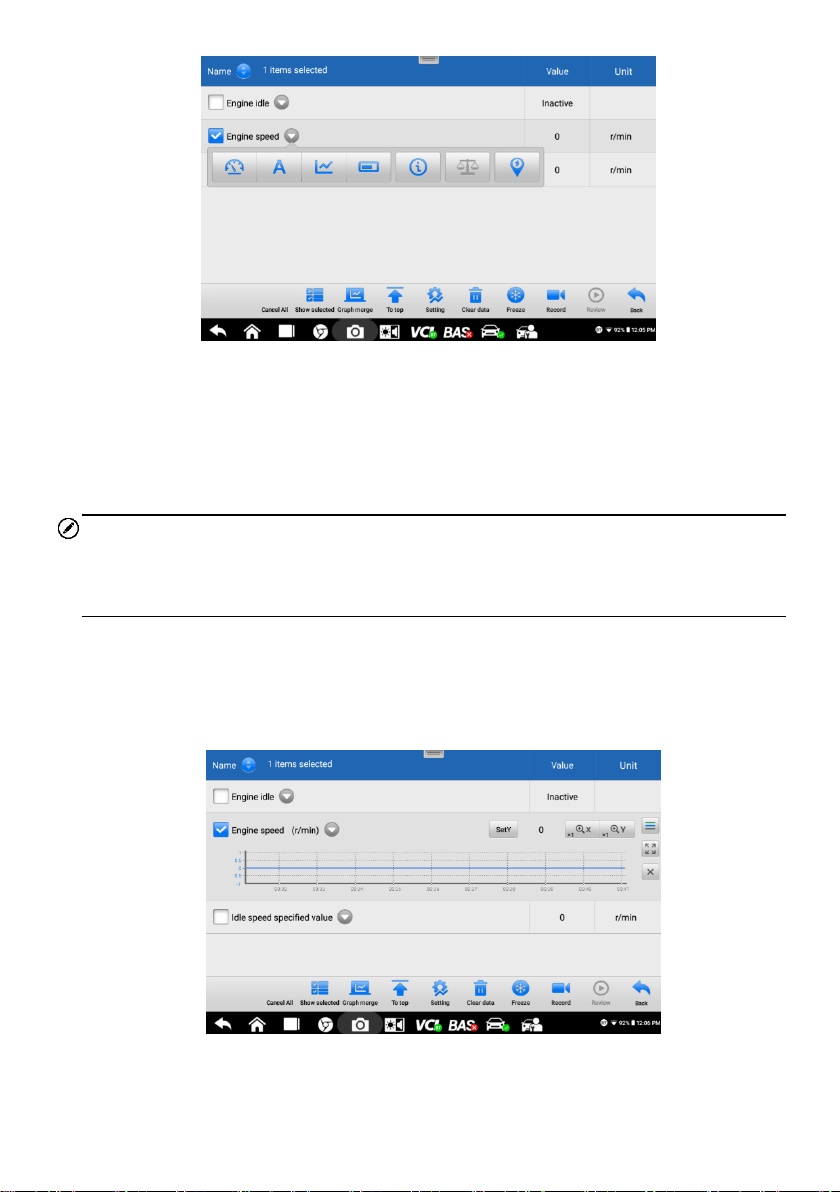
Waveform Graph Mode — displays the parameters in waveform graphs.
In this mode, five control buttons will display on the right side of the parameter item,
allowing you to manipulate the display status.
Figure 4-16 Sample Waveform Graph Mode Screen
1. Settings Button (SetY) — Sets the minimum and maximum value of the Y axis.
Loading ...
Loading ...
Loading ...