Loading ...
Loading ...
Loading ...
6-29
• The following is a typical graph condition specification for a regression graph.
S-Gph1 DrawOn, Linear, List 1, List 2, List 3 _
The same format can be used for the following types of graphs, by simply replacing “Linear”
in the above specification with the applicable graph type.
Linear Regression .......... Linear Logarithmic Regression ......Log
Med-Med......................... Med-Med Exponential Regression ......Exp(a·eˆb
x )
Quadratic Regression .... Quad Exp(a·bˆ
x )
Cubic Regression .......... Cubic Power Regression ...............Power
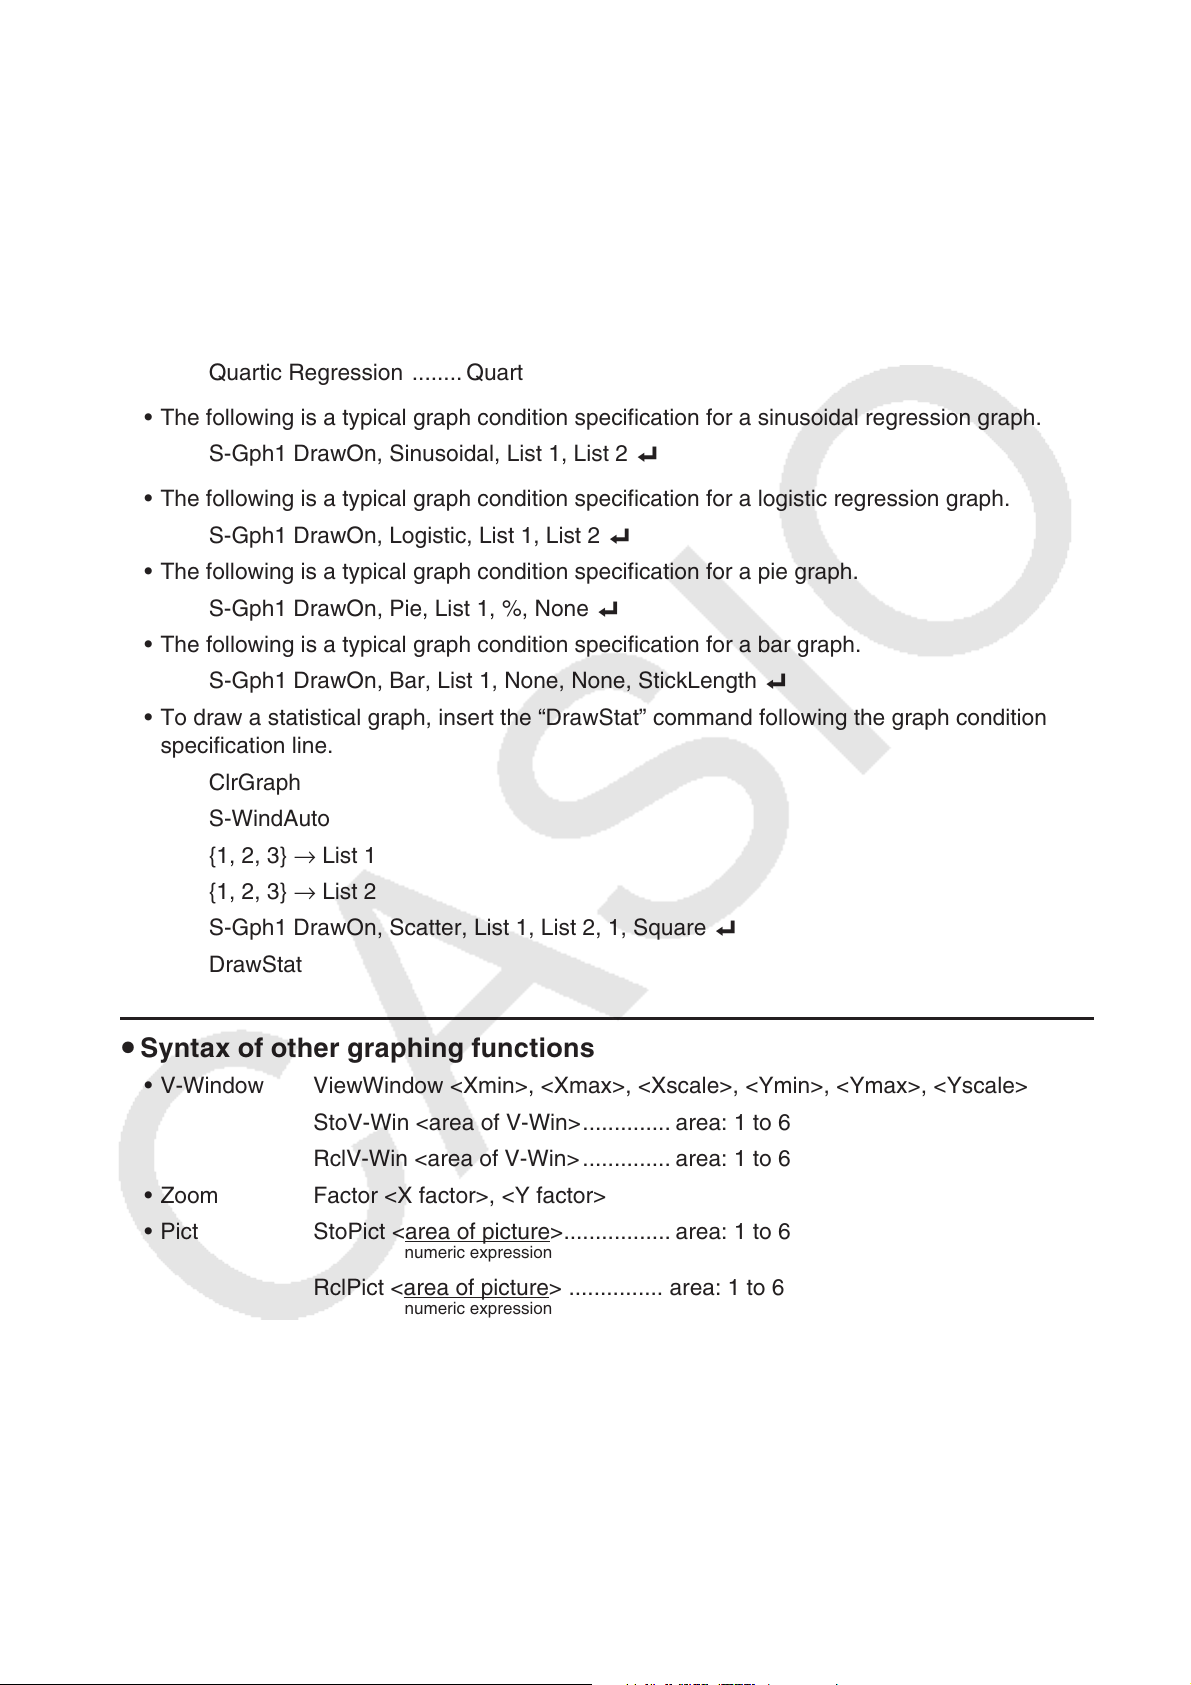
Quartic Regression ........ Quart
• The following is a typical graph condition specification for a sinusoidal regression graph.
S-Gph1 DrawOn, Sinusoidal, List 1, List 2 _
• The following is a typical graph condition specification for a logistic regression graph.
S-Gph1 DrawOn, Logistic, List 1, List 2 _
• The following is a typical graph condition specification for a pie graph.
S-Gph1 DrawOn, Pie, List 1, %, None _
• The following is a typical graph condition specification for a bar graph.
S-Gph1 DrawOn, Bar, List 1, None, None, StickLength _
• To draw a statistical graph, insert the “DrawStat” command following the graph condition
specification line.
ClrGraph
S-WindAuto
{1, 2, 3} → List 1
{1, 2, 3} → List 2
S-Gph1 DrawOn, Scatter, List 1, List 2, 1, Square _
DrawStat
u Syntax of other graphing functions
• V-Window ViewWindow <Xmin>, <Xmax>, <Xscale>, <Ymin>, <Ymax>, <Yscale>
StoV-Win <area of V-Win> .............. area: 1 to 6
RclV-Win <area of V-Win> .............. area: 1 to 6
• Zoom Factor <X factor>, <Y factor>
• Pict StoPict < area of picture >................. area: 1 to 6
numeric expression
RclPict < area of picture > ............... area: 1 to 6
numeric expression
Loading ...
Loading ...
Loading ...