Loading ...
Loading ...
Loading ...
5-10
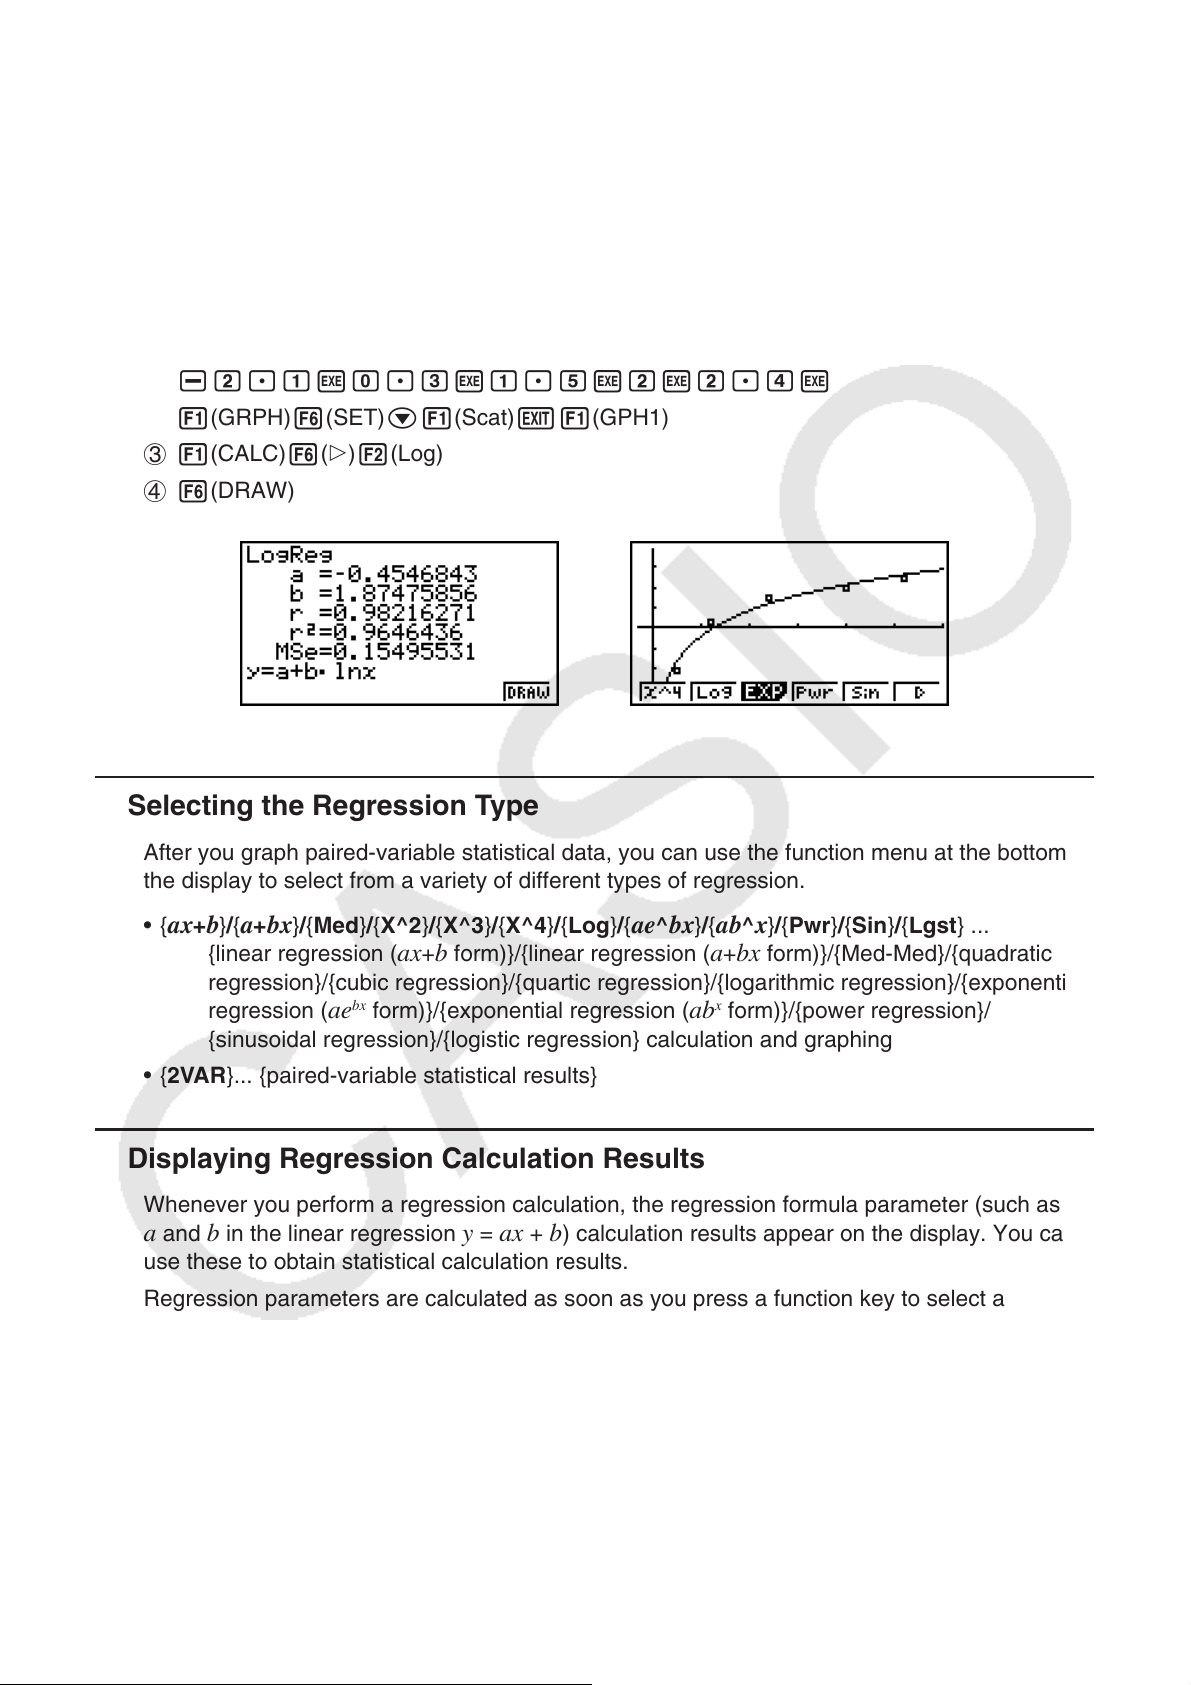
Example Input the two sets of data shown below and plot the data on a scatter
diagram. Next, perform logarithmic regression on the data to display the
regression parameters, and then draw the corresponding regression
graph.
0.5, 1.2, 2.4, 4.0, 5.2 ( xList)
–2.1, 0.3, 1.5, 2.0, 2.4 (
yList)
1 m STAT
2 a.fwb.cwc.ewewf.cwe
-c.bwa.dwb.fwcwc.ew
1(GRPH)6(SET)c1(Scat)J1(GPH1)
3 1(CALC)6(g)2(Log)
4 6(DRAW)
k Selecting the Regression Type
After you graph paired-variable statistical data, you can use the function menu at the bottom of
the display to select from a variety of different types of regression.
• {
ax+b}/{a+bx}/{Med}/{X^2}/{X^3}/{X^4}/{Log}/{ae^bx}/{ab^x}/{Pwr}/{Sin}/{Lgst} ...
{linear regression (
ax+b form)}/{linear regression ( a+bx form)}/{Med-Med}/{quadratic
regression}/{cubic regression}/{quartic regression}/{logarithmic regression}/{exponential
regression ( ae
bx
form)}/{exponential regression ( ab
x
form)}/{power regression}/
{sinusoidal regression}/{logistic regression} calculation and graphing
• { 2VAR }... {paired-variable statistical results}
k Displaying Regression Calculation Results
Whenever you perform a regression calculation, the regression formula parameter (such as
a and b in the linear regression y = ax + b) calculation results appear on the display. You can
use these to obtain statistical calculation results.
Regression parameters are calculated as soon as you press a function key to select a
regression type, while a graph is on the display.
The following parameters are used by linear regression, logarithmic regression, exponential
regression, and power regression.
r ..............correlation coefficient
r
2
.............coefficient of determination
MSe .........mean square error
Loading ...
Loading ...
Loading ...