Loading ...
Loading ...
Loading ...

5-19
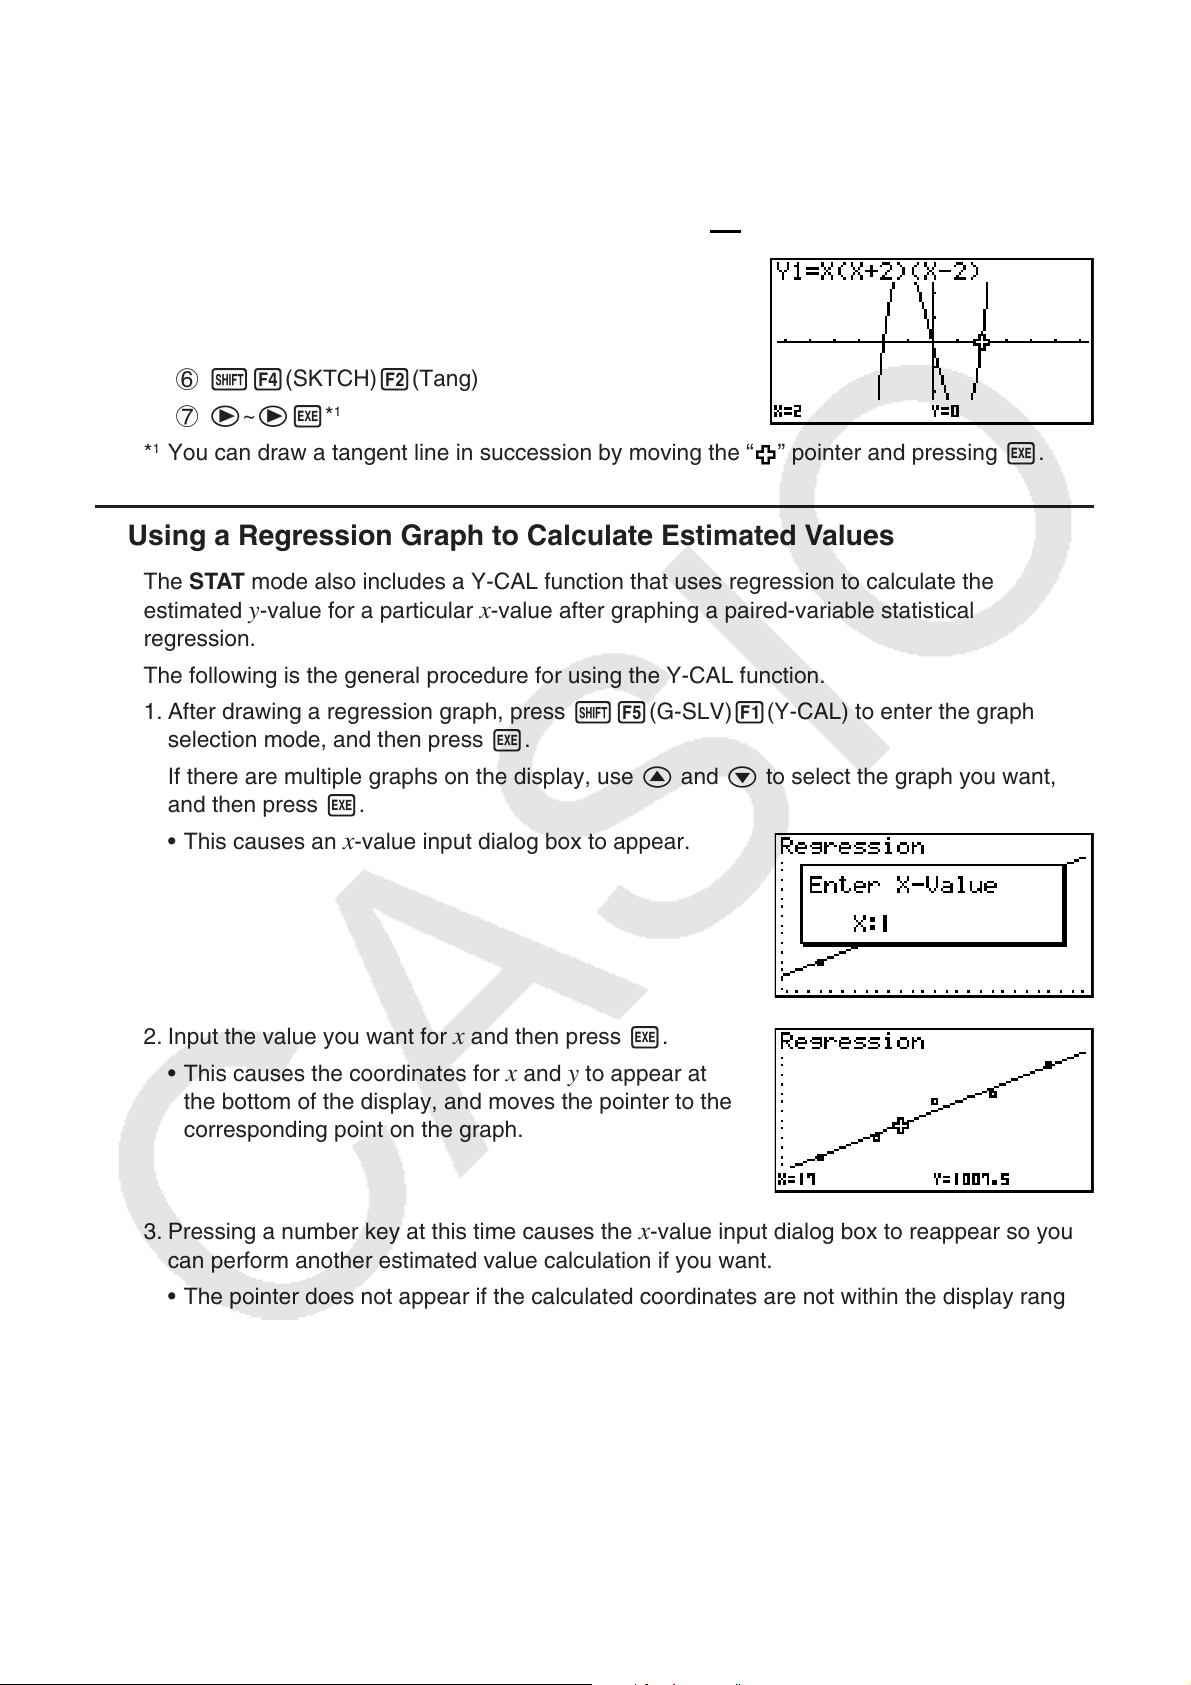
Example Draw a line that is tangent to point (2, 0) on the graph for y = x ( x + 2)
(
x – 2).
1 m GRAPH
2 !3(V-WIN)1(INIT)J
3 !m(SET UP) cccccccc1( )J
4 3(TYPE)1(Y=)v!*( ( )v+c
!/( ) )!*( ( )v-c!/( ) )w
5 6(DRAW)
6 !4(SKTCH)2(Tang)
7 e~ew*
1
*
1
You can draw a tangent line in succession by moving the “ ” pointer and pressing w.
k Using a Regression Graph to Calculate Estimated Values
The STAT mode also includes a Y-CAL function that uses regression to calculate the
estimated y-value for a particular x-value after graphing a paired-variable statistical
regression.
The following is the general procedure for using the Y-CAL function.
1. After drawing a regression graph, press !5(G-SLV)1(Y-CAL) to enter the graph
selection mode, and then press w.
If there are multiple graphs on the display, use f and c to select the graph you want,
and then press w.
• This causes an
x-value input dialog box to appear.
2. Input the value you want for
x and then press w.
• This causes the coordinates for
x and y to appear at
the bottom of the display, and moves the pointer to the
corresponding point on the graph.
3. Pressing a number key at this time causes the
x-value input dialog box to reappear so you
can perform another estimated value calculation if you want.
• The pointer does not appear if the calculated coordinates are not within the display range.
• The coordinates do not appear if “Off” is specified for the “Coord” item of the Setup screen.
• The Y-CAL function can also be used with a graph drawn by using DefG feature.
Loading ...
Loading ...
Loading ...