Loading ...
Loading ...
Loading ...
5-24
1. From the Main Menu, enter the STAT mode.
2. Input the height data into List 1 and the frequency data into List 2.
3. Perform the single-variable statistical calculations.
You can obtain the normalized variate immediately after
performing single-variable statistical calculations only.
2(CALC)6(SET)
1(LIST)bw
c2(LIST)cw!J(QUIT)
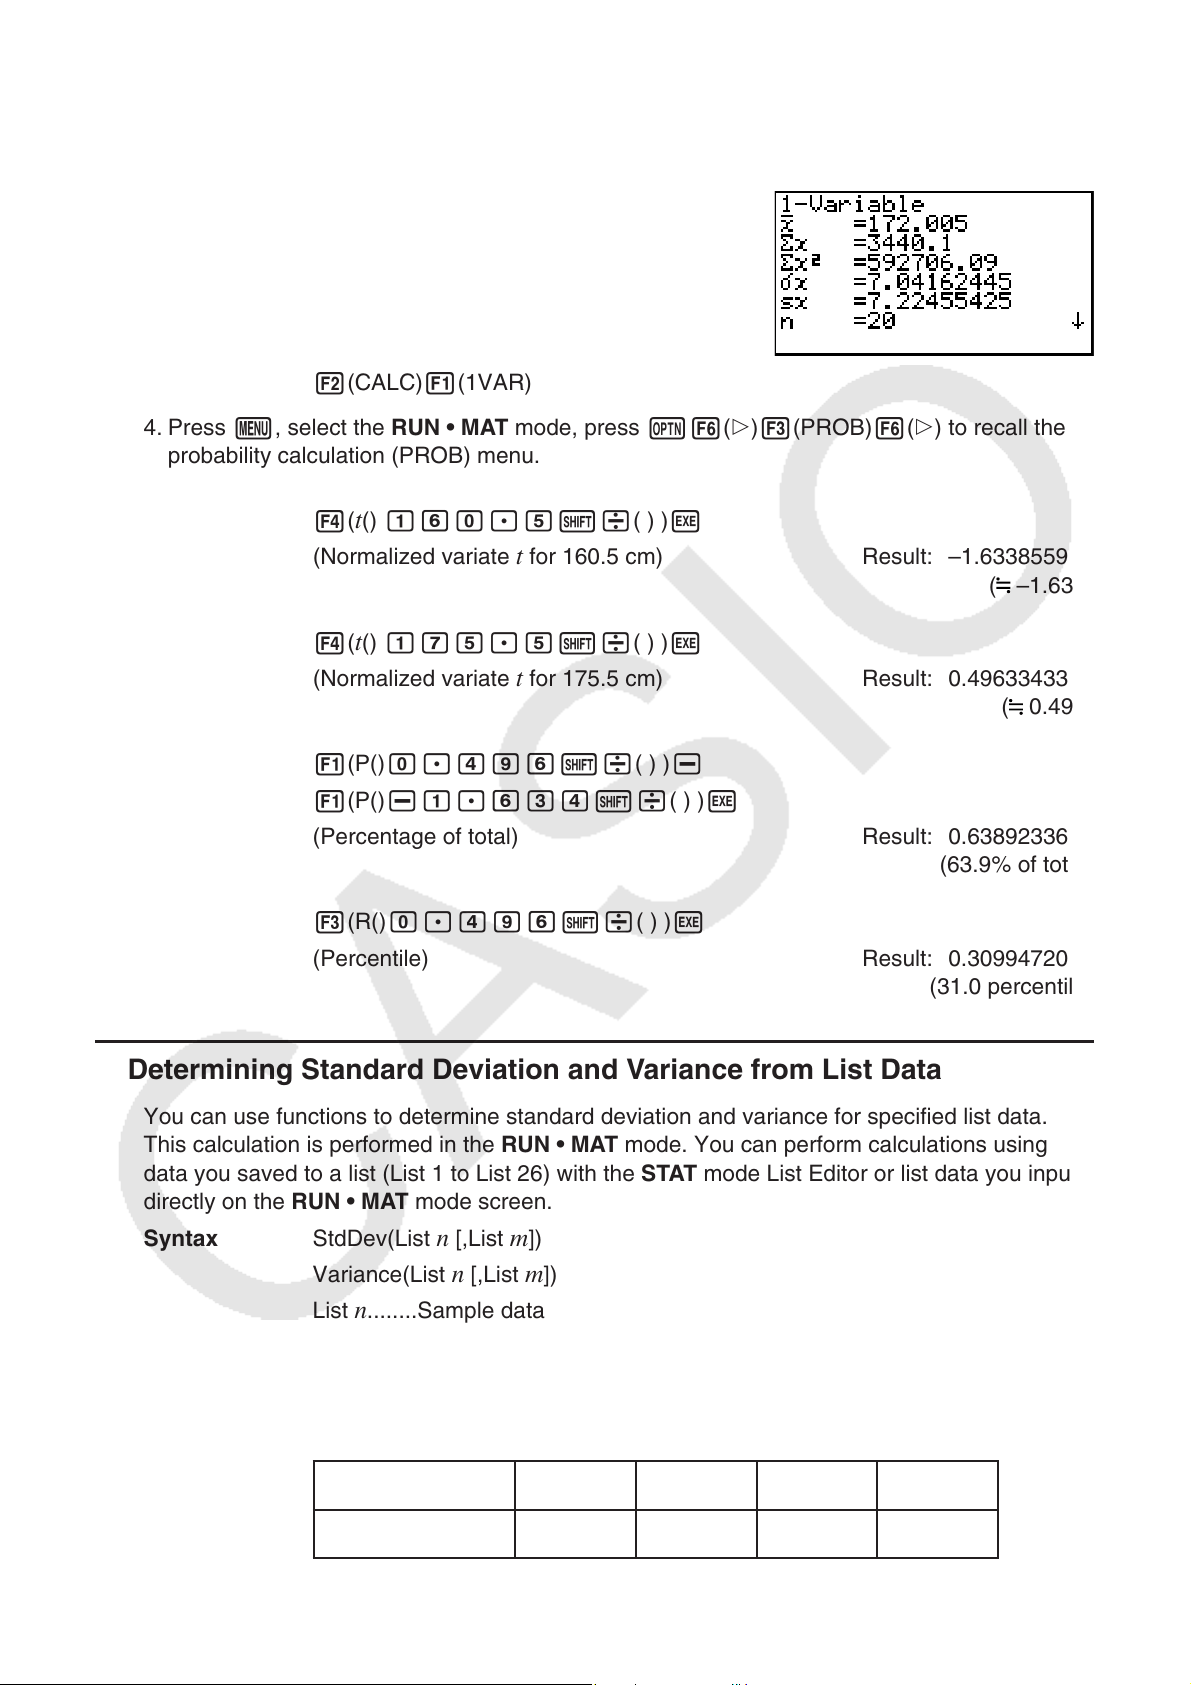
2(CALC)1(1VAR)
4. Press m, select the RUN • MAT mode, press K6(g)3(PROB)6(g) to recall the
probability calculation (PROB) menu.
4(
t() bga.f!/( ) )w
(Normalized variate
t for 160.5 cm) Result: –1.633855948
( –1.634)
4(
t() bhf.f!/( ) )w
(Normalized variate
t for 175.5 cm) Result: 0.4963343361
( 0.496)
1(P()a.ejg!/( ) )-
1(P()-b.gde!/( ) )w
(Percentage of total) Result: 0.6389233692
(63.9% of total)
3(R()a.ejg!/( ) )
w
(Percentile) Result: 0.3099472055
(31.0 percentile)
k Determining Standard Deviation and Variance from List Data
You can use functions to determine standard deviation and variance for specified list data.
This calculation is performed in the RUN • MAT mode. You can perform calculations using
data you saved to a list (List 1 to List 26) with the STAT mode List Editor or list data you input
directly on the RUN • MAT mode screen.
Syntax StdDev(List
n [,List m])
Variance(List
n [,List m])
List
n........Sample data
List
m.......Frequency data
Example To store the
x-data below in List 1, the frequency values in List 2, and
determine the standard deviation and variance
x
60 70 80 90
Frequency 3541
Loading ...
Loading ...
Loading ...