Loading ...
Loading ...
Loading ...
MID-STATIC DUCTED TECHNICAL OVERVIEW
G-9
ENGLISH
Testing
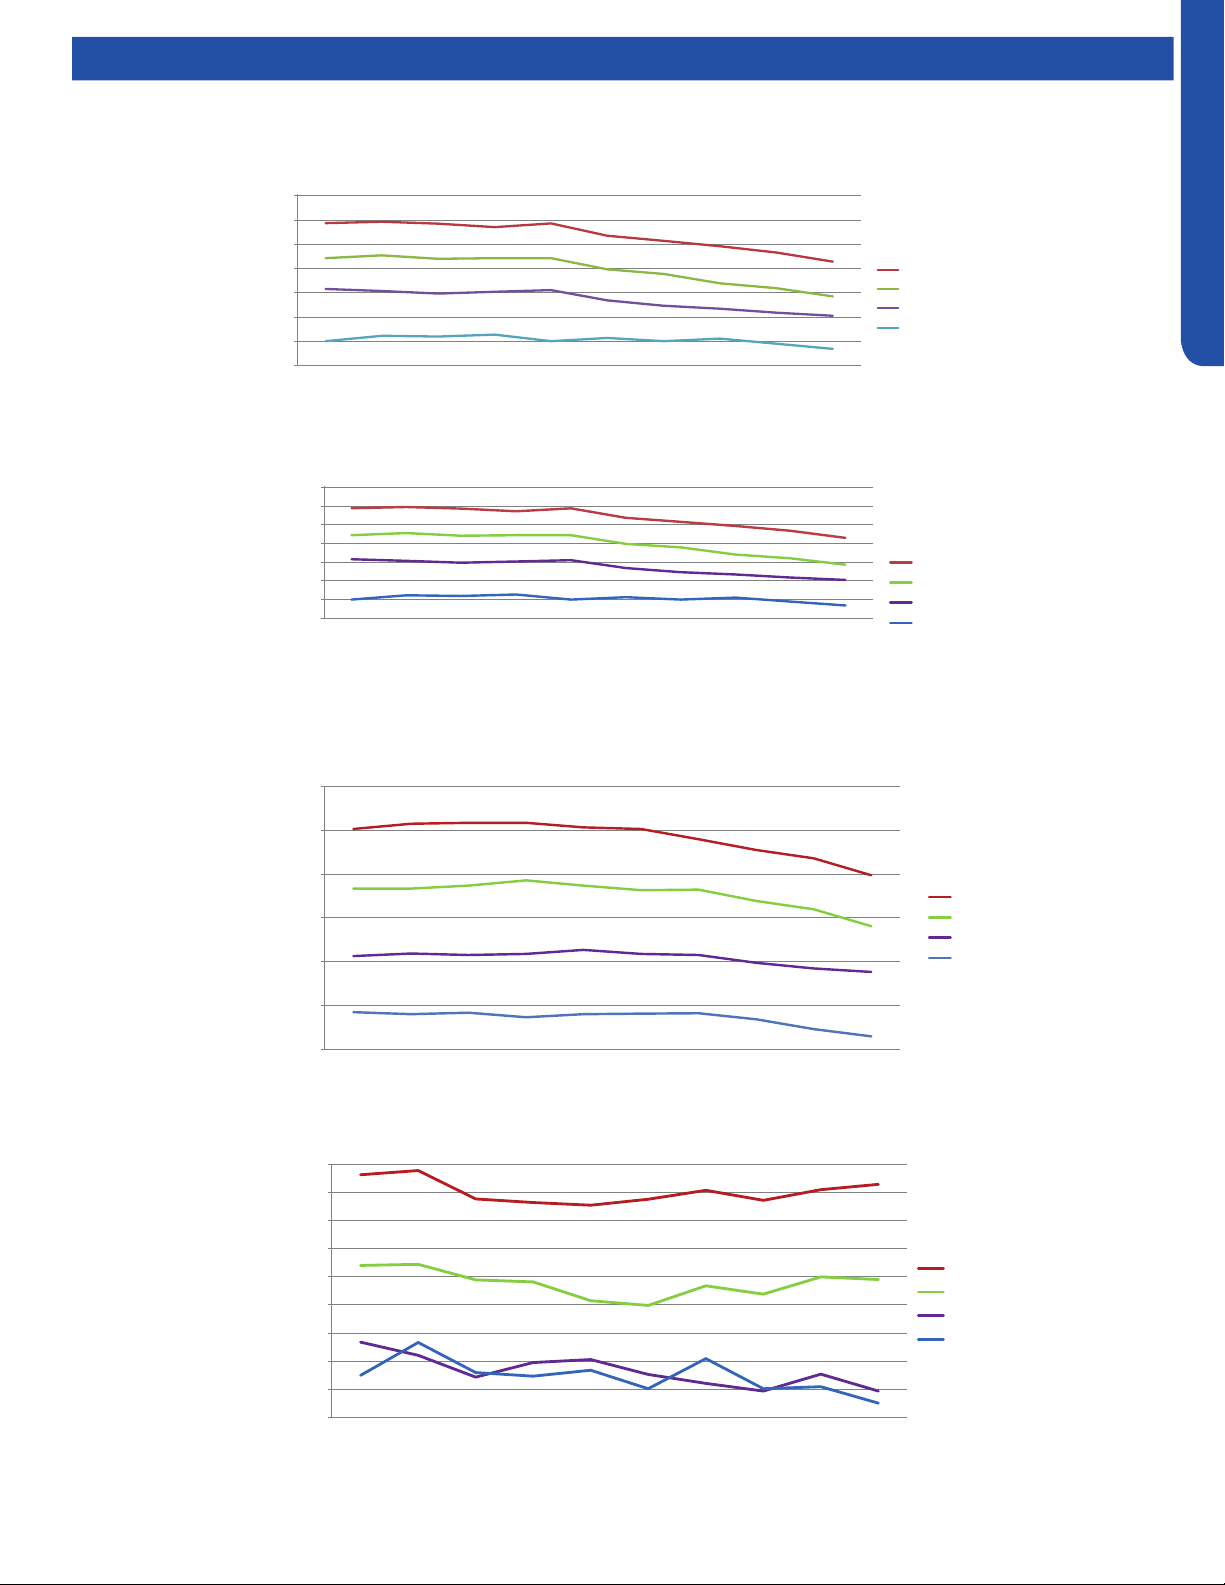
Static Pressure Charts
Air ow and static pressure curves
205
255
305
355
405
455
505
555
0.1 0.15 0.2 0.28 0.36 0.4 0.44 0.48 0.52 0.6
Static pressure (in.wc.)
AM09SL2VHA air flow and static pressure chart
High(cfm)
Med(cfm)
Low(cfm)
Quiet(cfm)
(
USYM09UCDSA
Air ow and static pressure curves
205.0
255.0
305.0
355.0
405.0
455.0
505.0
555.0
External
static
pressure
(in. wc.)
0.10 0.15 0.20 0.28 0.36 0.40 0.44 0.48 0.52
Air flow cfm
Static pressure (in.wc.)
High(cfm)
Med(cfm)
Low(cfm)
Quiet(cfm)
USYM12UCDSA
350.0
400.0
450.0
500.0
550.0
600.0
650.0
0.10 0.15 0.20 0.28 0.36 0.40 0.44 0.48 0.52 0.60
Air flow cfm
Static pressure (in.wc.)
High(cfm)
Med(cfm)
Low(cfm)
Quiet(cfm)
USYM18UCDSA
400.0
450.0
500.0
550.0
600.0
650.0
700.0
750.0
800.0
850.0
0.10 0.15 0.20 0.28 0.36 0.40 0.44 0.48 0.52 0.60
Air flow cfm
Static pressure (in.wc.)
High m3/h
Med m3/h
Low m3/h
Quiet m3/h
USYM24UCDSA
Loading ...
Loading ...
Loading ...