Loading ...
Loading ...
Loading ...
SHS800 Series 59
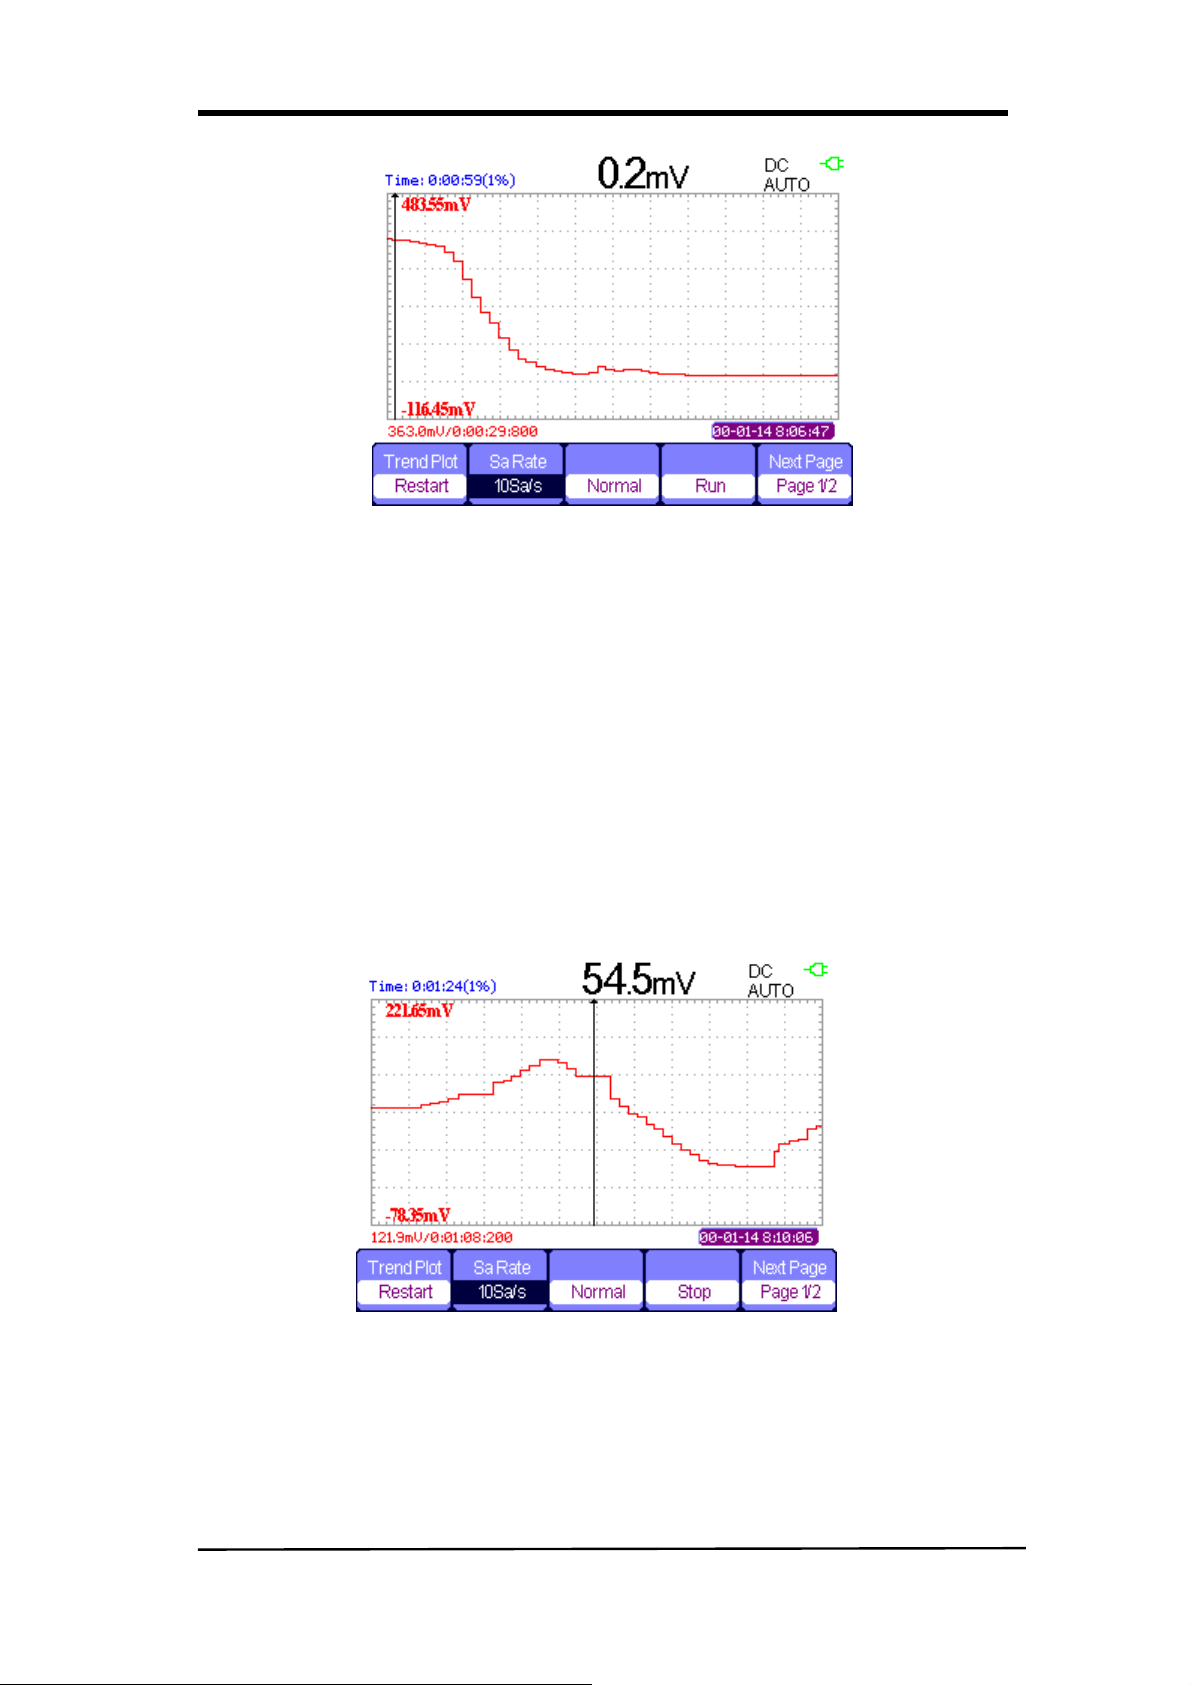
Figure 4-15 Multimeter Trend Plot Recording Curve
3. Press 【F4】 to stop or run recording data.
4. At the second page of the menu you can choose manual or auto mode to record
the data.
Display the record data
5. Press 【F3】 to choose data display mode.
Normal mode: the screen displays the data up to the minute. The recorded data
before saved in the memorizer.
Full view mode: the screen display all recorded data in the memorizer.
6. Zoom function: under full screen mode, press time base to zoom in or zoom out.
7. Data analysis: move cursor, analyzing data over time.
Figure 4-16 Analysis Trend Plot Data
8. Save waveform: save the recorded waveform to exterior storage device to make
more detailed analysis.
9. Press Return to exit trend plot.
Loading ...
Loading ...
Loading ...