Loading ...
Loading ...
Loading ...
SHS800 Series 53
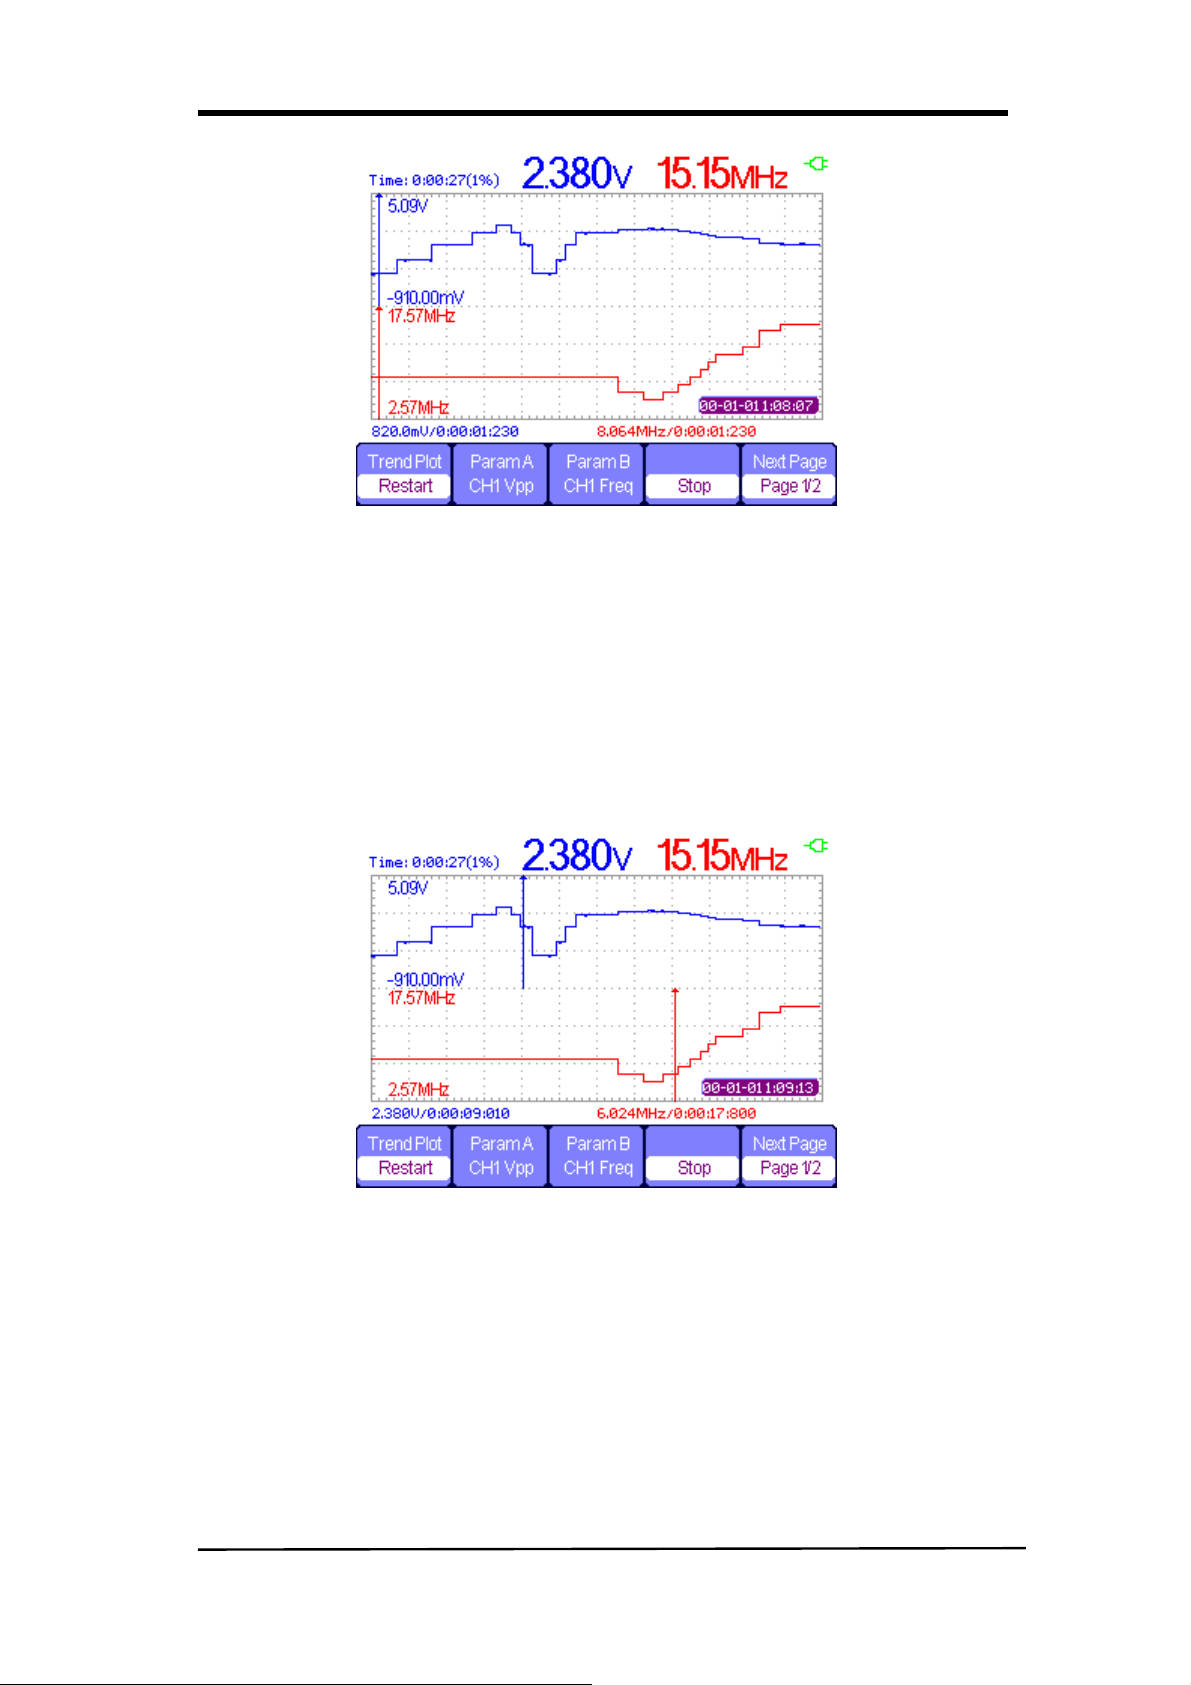
Figure 4-5 Trend Plot record Curve
Display recorded data
6. Press 【F5】 to enter the second page of trend plot menu.
7. Press 【F1】 to choose data display mode.
Normal: the screen displays the data up to the minute.
View All: the screen displays all data in the memory.
8. Zoom function: under full screen mode, press time base to zoom in or zoom out.
9. Data analysis: move cursor, analyzing data over time.
Figure 4-6 Analyzing Trend Plot
10. Save waveform: save the recorded waveform to exterior storage device to make
more detailed analysis.
11. Press Return to exit trend plot.
Loading ...
Loading ...
Loading ...