Loading ...
Loading ...
Loading ...
SHS800 Series 51
Oscilloscope Trend Plot
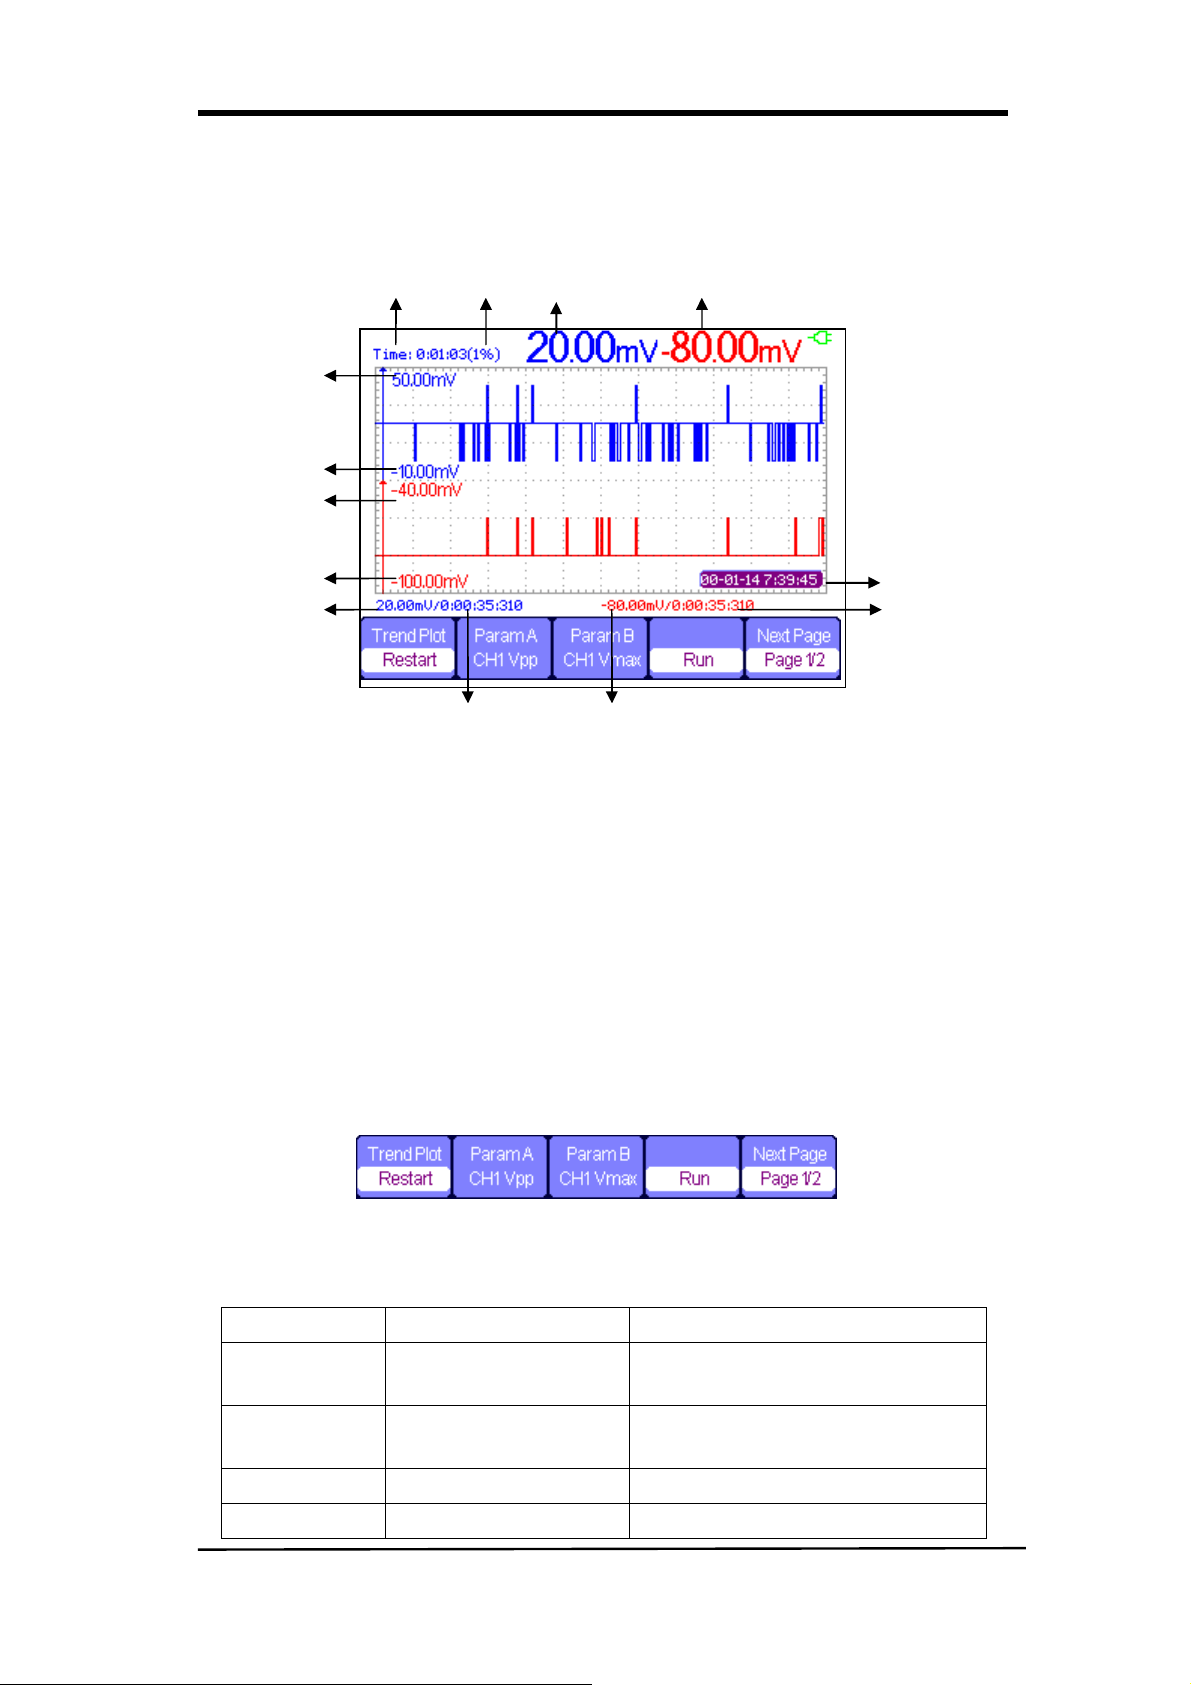
Figure 4-1 Scope trend plot user interface
1. current recorded time
2. the percentage of recorded date take in the whole memory
3. Value of the latest recorded data point A
4. Value of the latest recorded data point B
5. real time
6. sampling time of the cursor point
7. parameter measurement of the cursor point
8. vertical scale
9. vertical scale
Figure 4-2 Scope Trend plot Function Menu 1
Table 4-1 Scope Trend plot Function Menu 1
Option Setting Instruction
Trend Plot Restart
Quilt the current data and start to
record afresh.
Parameter A/B
Choose the parameter
to be measured.
Voltage , time and delay
measurement
Run/Stop Stop or continue recording data
Next Page Page 1/2 Enter the second page of the menu.
1 2 3 4
5
6
7 6
8
7
9
8
9
Loading ...
Loading ...
Loading ...