Loading ...
Loading ...
Loading ...
SIGLENT
SDS1000CFL User Manual 25
that you want to analyze in the center eight divisions of the screen.
The oscilloscope calculates the FFT spectrum using the center 1024 points of
the time-domain waveform.
● Turn the “Volts/div” knob to ensure that the entire waveform remains on the
screen.
● Turn the “S/div” knob to provide the resolution you want in the FFT spectrum.
● If possible, set the oscilloscope to display many signal cycles.
To display FFT correctly, follow these steps:
1. Push the “MATH” button.
2. Set the “Operation” option to FFT.
3. Press “Source” button to select “CH1” ,”CH2”, ”CH3” or “CH4” according to
input signal channel.
4. According to Nyquist law, turn the “S/div” knob to adjust the sampling rate
(This parameter is displayed behind the time base parameter) is at least double
than input signal frequency.
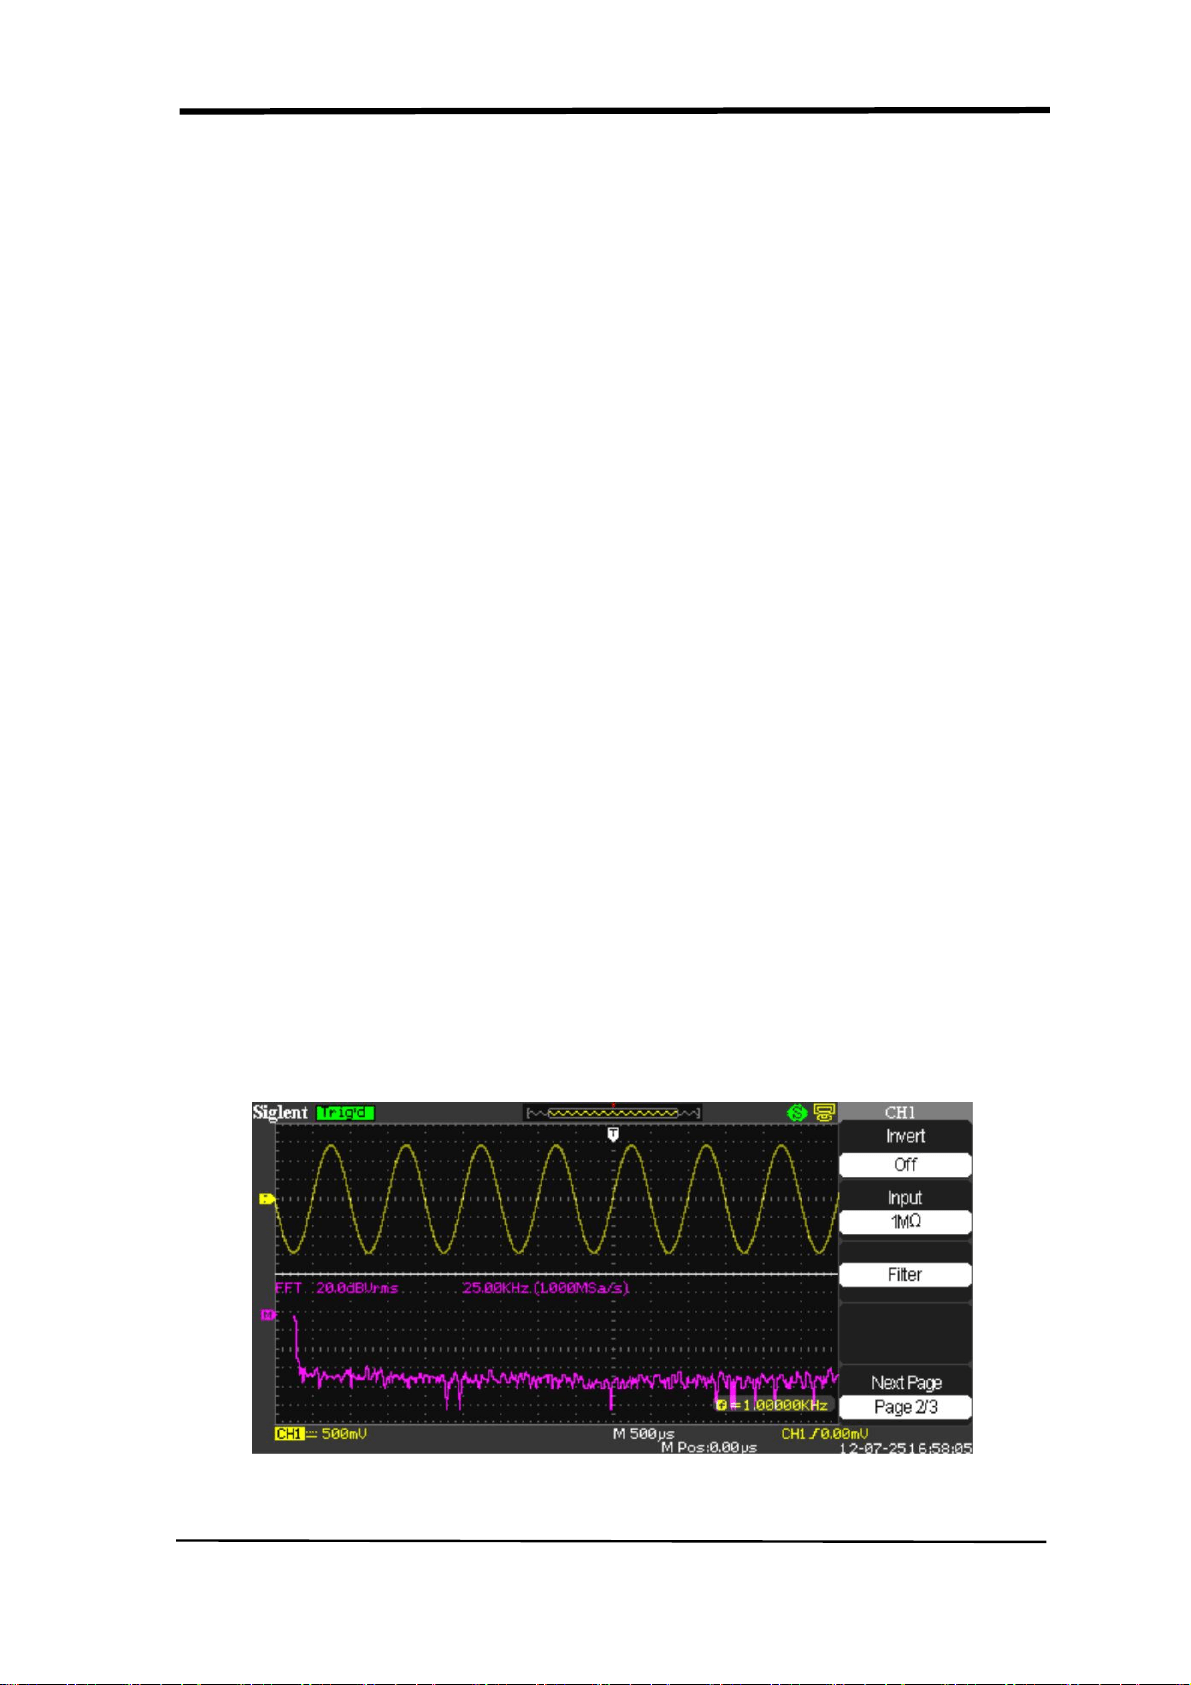
2. Displaying the FFT Spectrum
Press the MATH button to display the Math Menu. Use the options to select the
Source channel, Window algorithm, and FFT Zoom factor. You can display only
one FFT spectrum at a time. You can select “Full screen” or “Split” in “Display”
option to display FFT waveform on full screen or display channel waveform and its
FFT waveform on half screen at a time.
Picture2.6-10 FFT function
Loading ...
Loading ...
Loading ...