
Loading ...
Loading ...
Loading ...
40
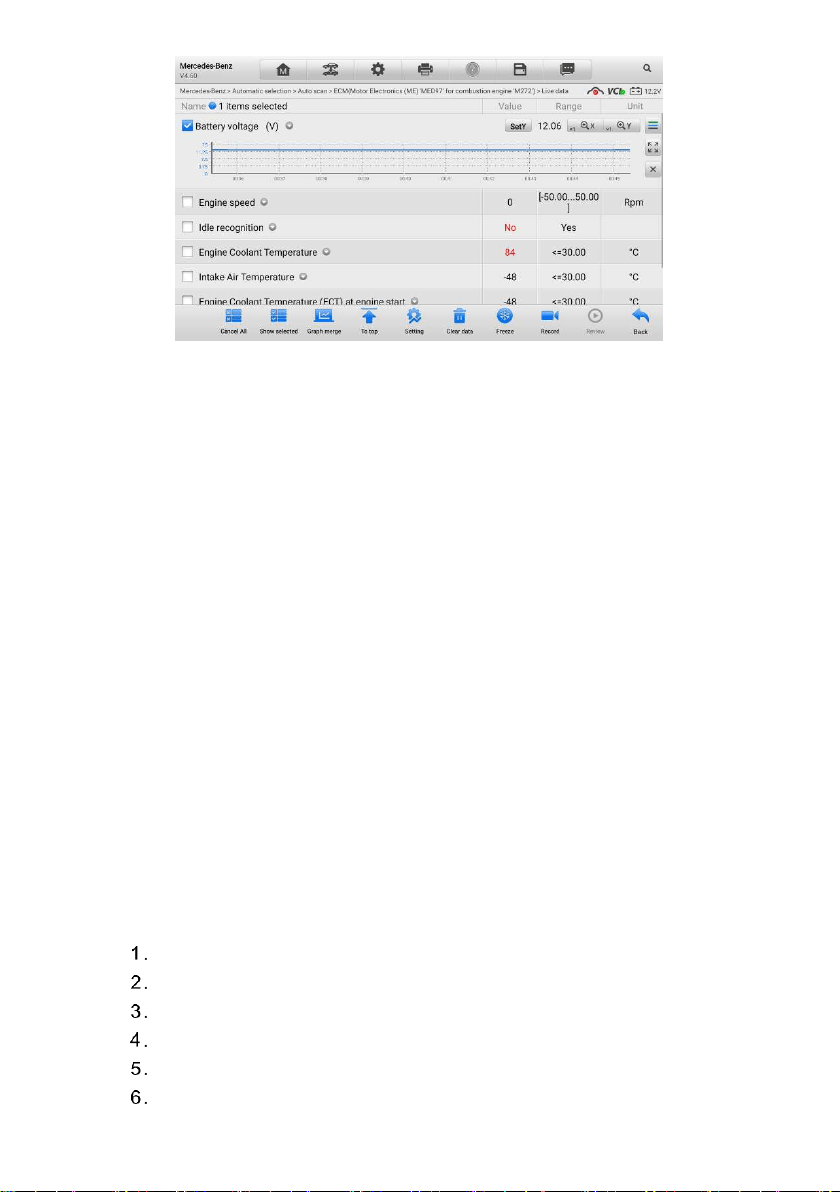
Figure 4-13 Waveform Graph Mode Screen
Settings (SetY) — sets the minimum and maximum value of the Y axis.
Edit — edits the waveform color and the line thickness.
Scale — changes the scale values, which are displayed below the
waveform graph. There are 4 scales available: x1, x2, x4 and x8.
Zoom-in — displays the selected data graph in full screen.
Exit — exits the waveform graph mode.
Full Screen Display — this option is only available in the waveform graph mode,
and mostly used in Graph Merge status for data comparison. There are three control
buttons available on the top right side of the screen under this mode.
Edit — opens an edit window, in which you can set the waveform color and
the line thickness displayed for the selected parameter item.
Scale — changes the scale values, which are displayed below the
waveform graph. There are 4 scales available: x1, x2, x4 and x8.
Zoom-out — exits full screen display.
Exit — exits the waveform graph mode.
To edit the waveform color and line thickness in a data graph
Select 1 to 3 parameter items to display in Waveform Graph mode.
Tap the Zoom-in button on the right to display the data graph in full screen.
Tap the Edit button, and an edit window displays.
Select a parameter item on the left column.
Select a desired sample color from the second column.
Select a desired sample line thickness from the right column.
Loading ...
Loading ...
Loading ...