Loading ...
Loading ...
Loading ...
TI-83 Plus Activities 566
Graphing Inequalities
Problem
Graph the inequality 0
.
4X
3
N
3X + 5 < 0
.
2X + 4. Use the
TEST
menu
operations to explore the values of X where the inequality is true and
where it is false.
Procedure
1. Press
z
. Select
Dot
,
Simul
, and the default settings. Setting
Dot
mode changes all graph style icons to
í
(dot) in the
Y=
editor.
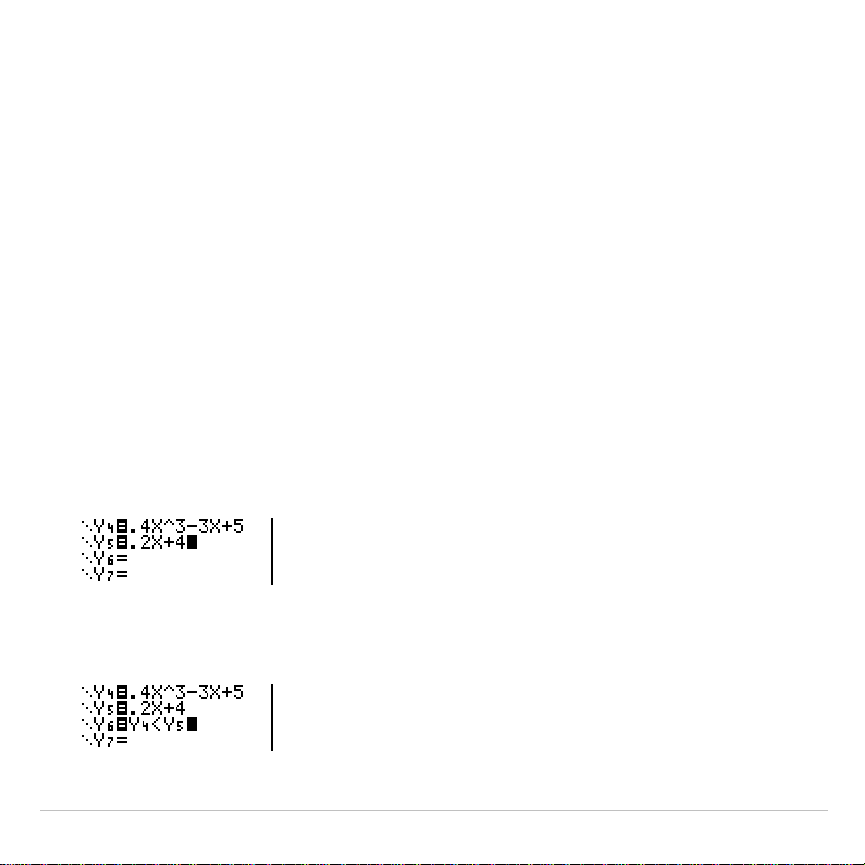
2. Press
o
. Turn off all functions and stat plots. Enter the left side of the
inequality as
Y4
and the right side as
Y5
.
3. Enter the statement of the inequality as
Y6
. This function evaluates to
1
if true or
0
if false.
Loading ...
Loading ...
Loading ...