Loading ...
Loading ...
Loading ...
TI-83 Plus Inferential Statistics and Distributions 435
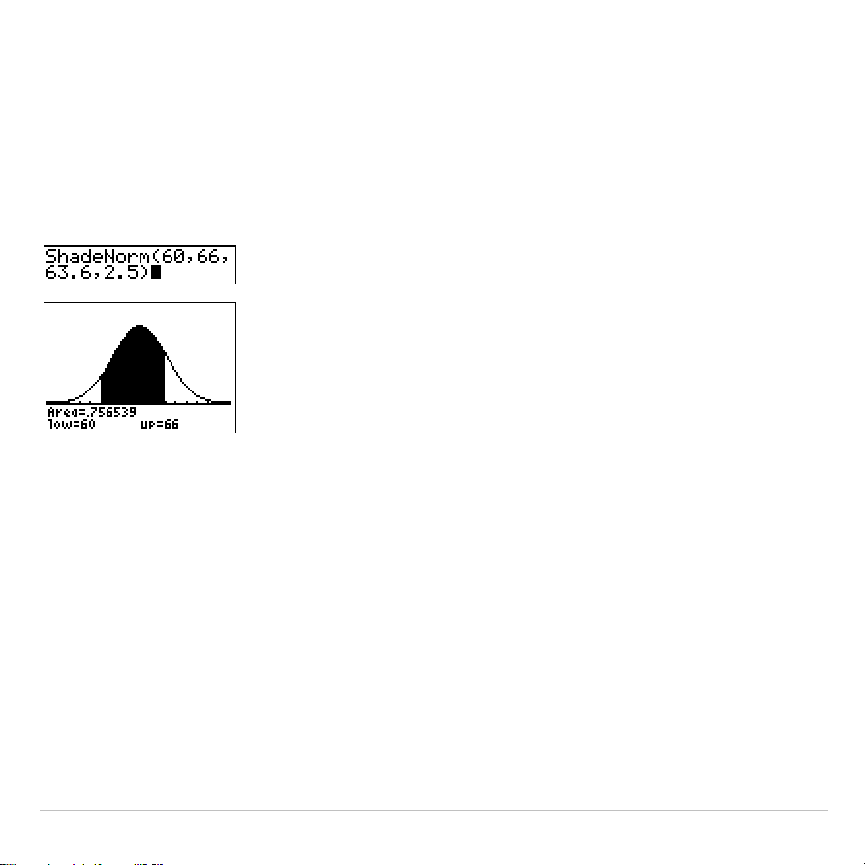
ShadeNorm(
ShadeNorm(
draws the normal density function specified by mean
m
and
standard deviation
s
and shades the area between
lowerbound
and
upperbound
. The defaults are
m
=0 and
s
=1.
ShadeNorm(
lowerbound
,
upperbound
[
,
m
,
s
]
)
Note: For this example,
Xmin = 55
Xmax = 72
Ymin =
L
.05
Ymax = .2
Shade_t(
Shade_t(
draws the density function for the Student-
t
distribution specified
by
df
(degrees of freedom) and shades the area between
lowerbound
and
upperbound
.
Loading ...
Loading ...
Loading ...