Loading ...
Loading ...
Loading ...
TI-83 Plus Statistics 325
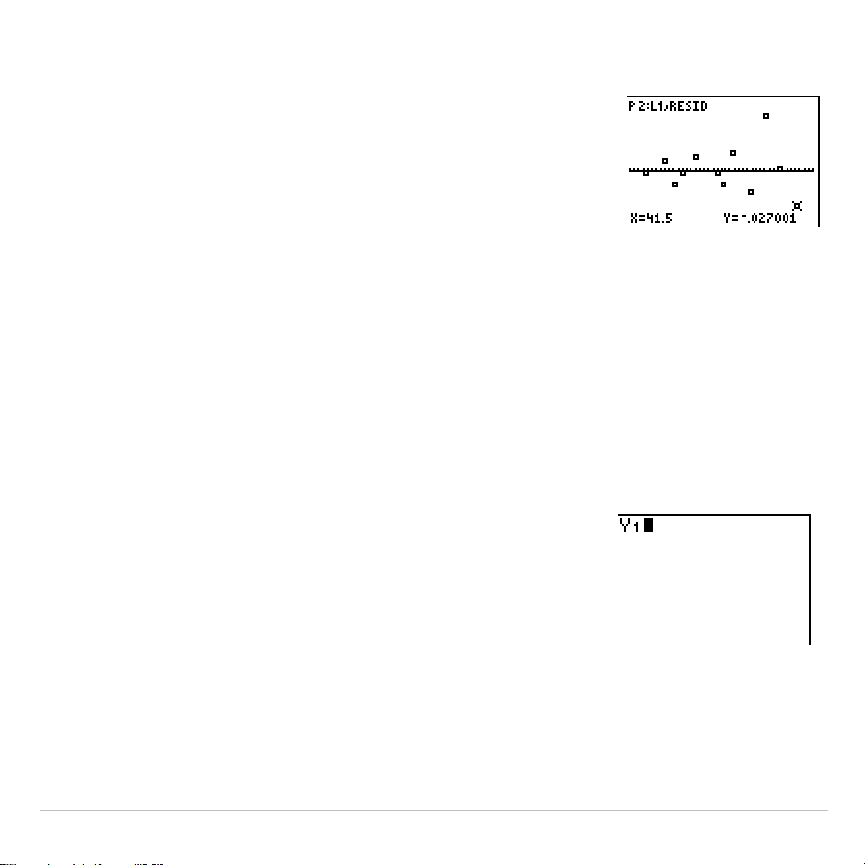
To see the magnitudes of the residuals, continue with these steps.
29. Press
r
.
Press
~
and
|
to trace the data. Observe the
values for
Y
at each point.
With this model, the largest positive residual is
about 0.041 and the smallest negative residual
is about
L
0.027. All other residuals are less
than 0.02 in magnitude.
Now that you have a good model for the relationship between length and
period, you can use the model to predict the period for a given string
length. To predict the periods for a pendulum with string lengths of 20 cm
and 50 cm, continue with these steps.
30. Press
~
1
to display the
VARS Y
.
VARS
FUNCTION
secondary menu, and then press
1
to
select
1:Y1
.
Y1
is pasted to the home screen.
Loading ...
Loading ...
Loading ...