Loading ...
Loading ...
Loading ...
TI-83 Plus Statistics 376
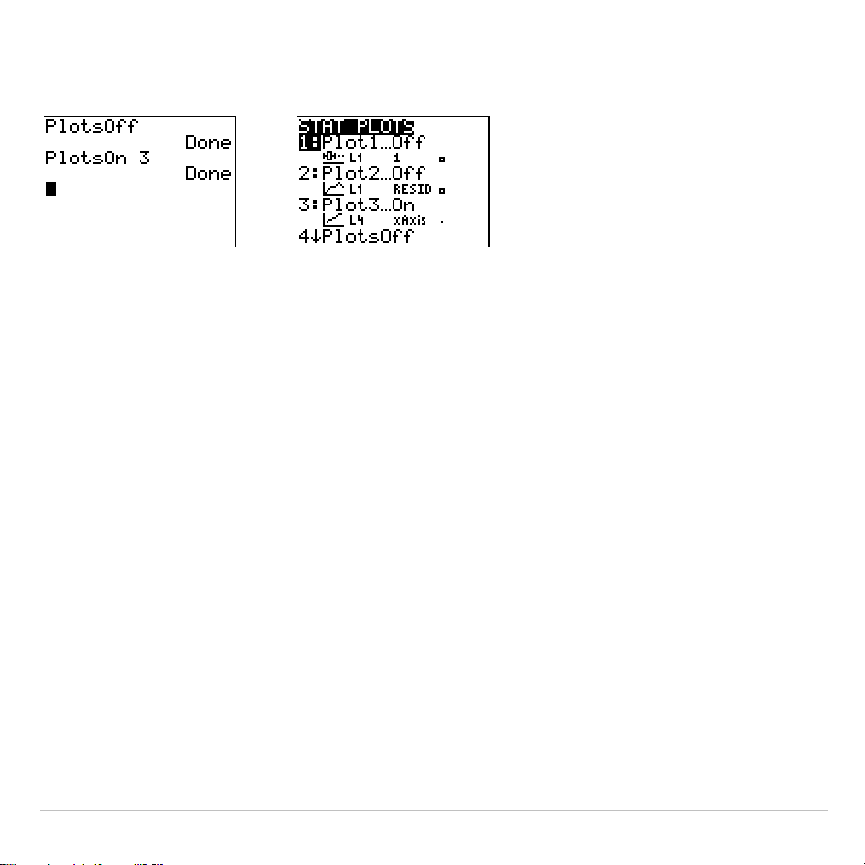
PlotsOff
[
1,2,3
]
PlotsOn
[
1,2,3
]
Note: You also can turn on and turn off stat plots in the top line of the Y= editor
(Chapter 3).
Defining the Viewing Window
Stat plots are displayed on the current graph. To define the viewing
window, press
p
and enter values for the window variables.
ZoomStat
redefines the viewing window to display all statistical data
points.
Tracing a Stat Plot
When you trace a scatter plot or xyLine, tracing begins at the first
element in the lists.
When you trace a histogram, the cursor moves from the top center of
one column to the top center of the next, starting at the first column.
Loading ...
Loading ...
Loading ...