Loading ...
Loading ...
Loading ...
TI-83 Plus Statistics 321
17. Press
Í
.
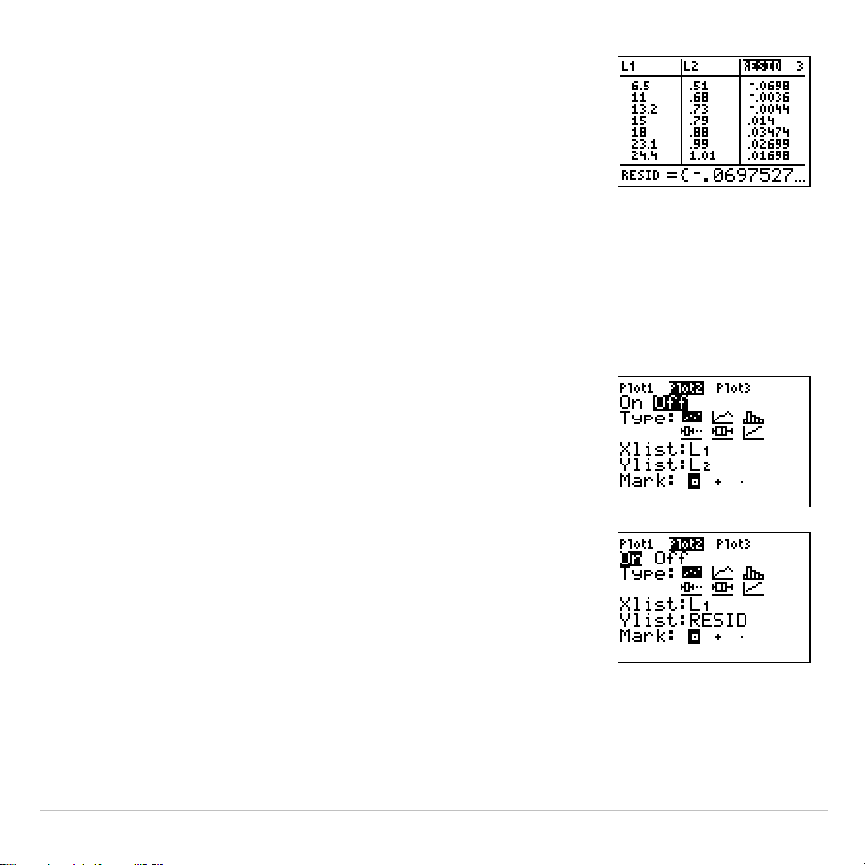
RESID
is stored in column
3
of the
stat list editor.
Press
†
repeatedly to examine the residuals.
Notice that the first three residuals are negative. They correspond to the
shortest pendulum string lengths in
L1
. The next five residuals are
positive, and three of the last four are negative. The latter correspond to
the longer string lengths in
L1
. Plotting the residuals will show this pattern
more clearly.
18. Press
y
,
2
to select
2:Plot2
from the
STAT PLOTS
menu. The stat plot editor is
displayed for plot 2.
19. Press
Í
to select
On
, which turns on plot 2.
Press
†
Í
to select
"
(scatter plot). Press
†
y
d
to specify
Xlist:L1
for plot 2. Press
†
[
R
] [
E
] [
S
] [
I
] [
D
] (alpha-lock is on) to specify
Ylist:RESID
for plot 2. Press
†
Í
to select
›
as the mark for each data point on the
scatter plot.
Loading ...
Loading ...
Loading ...