Loading ...
Loading ...
Loading ...
TI-83 Plus Inferential Statistics and Distributions 436
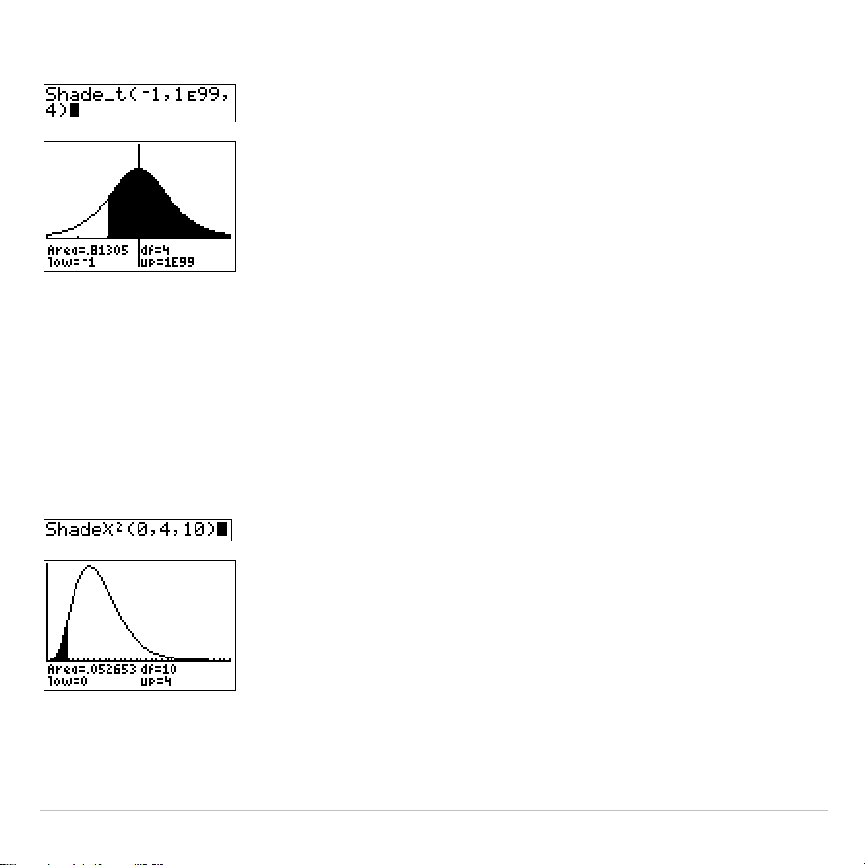
Shade_t(
lowerbound
,
upperbound
,
df
)
Note: For this example,
Xmin =
L
3
Xmax = 3
Ymin =
L
.15
Ymax = .5
Shade
c
2
(
Shade
c
2
(
draws the density function for the
c
2
(chi-square) distribution
specified by
df
(degrees of freedom) and shades the area between
lowerbound
and
upperbound
.
Shade
c
2
(
lowerbound
,
upperbound
,
df
)
Note: For this example,
Xmin = 0
Xmax = 35
Ymin =
L
.025
Ymax = .1
Loading ...
Loading ...
Loading ...