Loading ...
Loading ...
Loading ...
TI-83 Plus Sequence Graphing 195
Using Web Plots to Illustrate Convergence
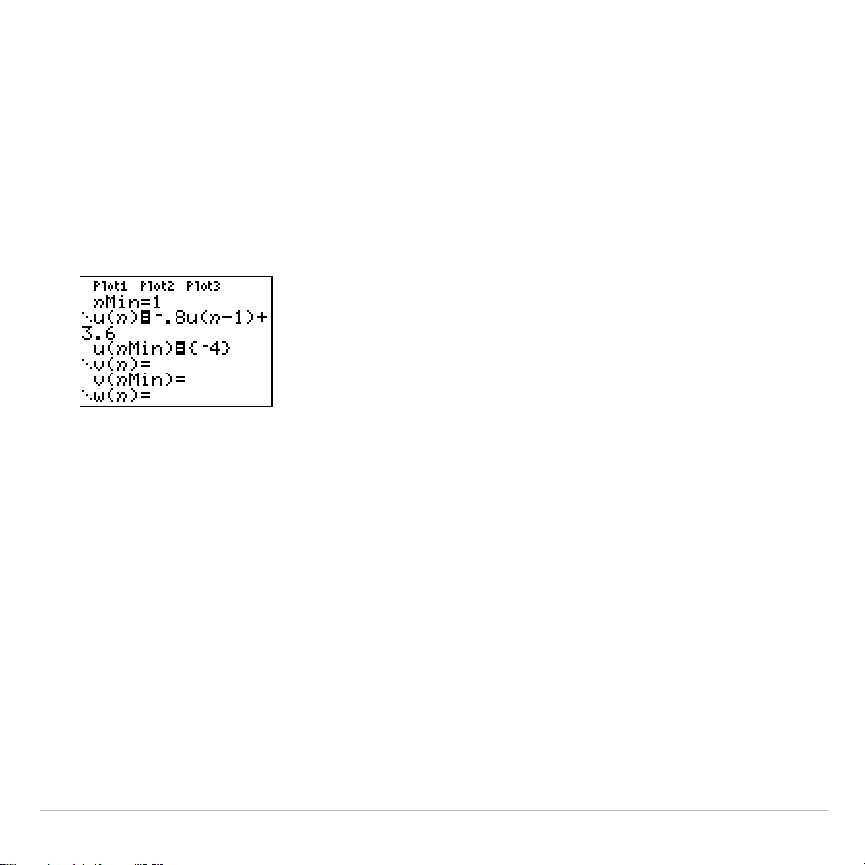
Example: Convergence
1. Press
o
in
Seq
mode to display the sequence
Y=
editor. Make sure
the graph style is set to
í
(dot), and then define
n
Min
,
u(
n
)
and
u(
n
Min)
as shown below.
2. Press
y
.
Í
to set
Time
axes format.
3. Press
p
and set the variables as shown below.
n
Min=1 Xmin=0 Ymin=
L
10
n
Max=25 Xmax=25 Ymax=10
PlotStart=1 Xscl=1 Yscl=1
PlotStep=1
Loading ...
Loading ...
Loading ...