Loading ...
Loading ...
Loading ...
TI-83 Plus Statistics 318
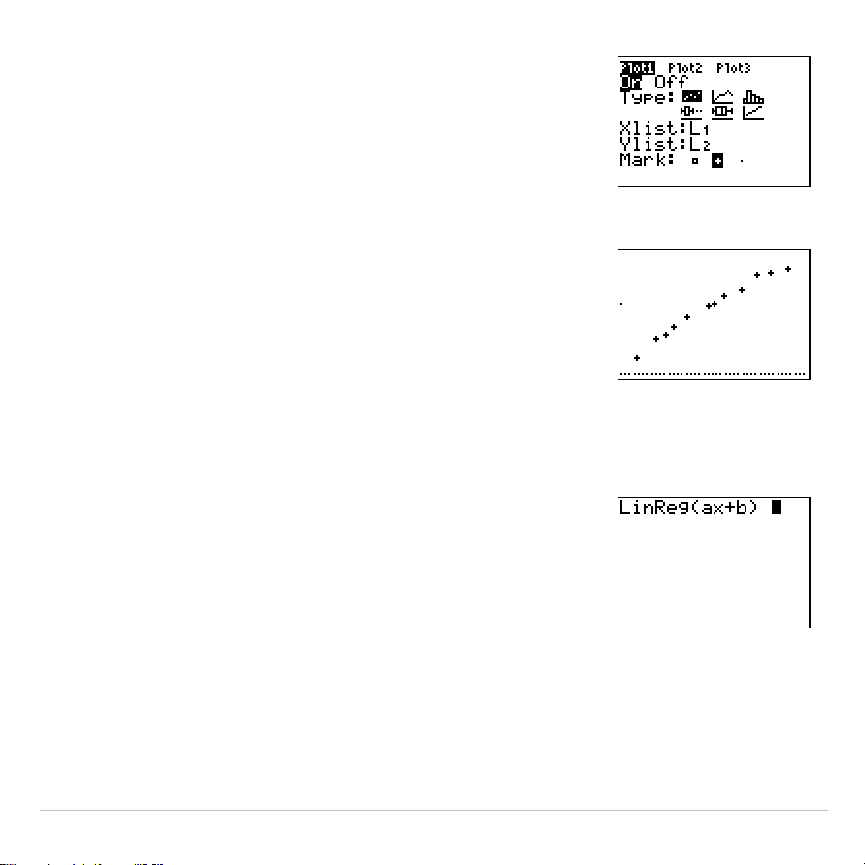
8. Press
Í
to select
On
, which turns on plot 1.
Press
†
Í
to select
"
(scatter plot). Press
†
y
d
to specify
Xlist:L1
for plot 1. Press
†
y
e
to specify
Ylist:L2
for plot 1. Press
†
~
Í
to select
+
as the
Mark
for each data point
on the scatter plot.
9. Press
q
9
to select
9:ZoomStat
from the
ZOOM
menu. The window variables are adjusted
automatically, and plot 1 is displayed. This is a
scatter plot of the time-versus-length data.
Since the scatter plot of time-versus-length data appears to be
approximately linear, fit a line to the data.
10. Press
…
~
4
to select
4:LinReg(ax+b)
(linear
regression model) from the
STAT CALC
menu.
LinReg(ax+b)
is pasted to the home screen.
Loading ...
Loading ...
Loading ...