Loading ...
Loading ...
Loading ...

TI-83 Plus Function Graphing 118
Setting the Graph Style
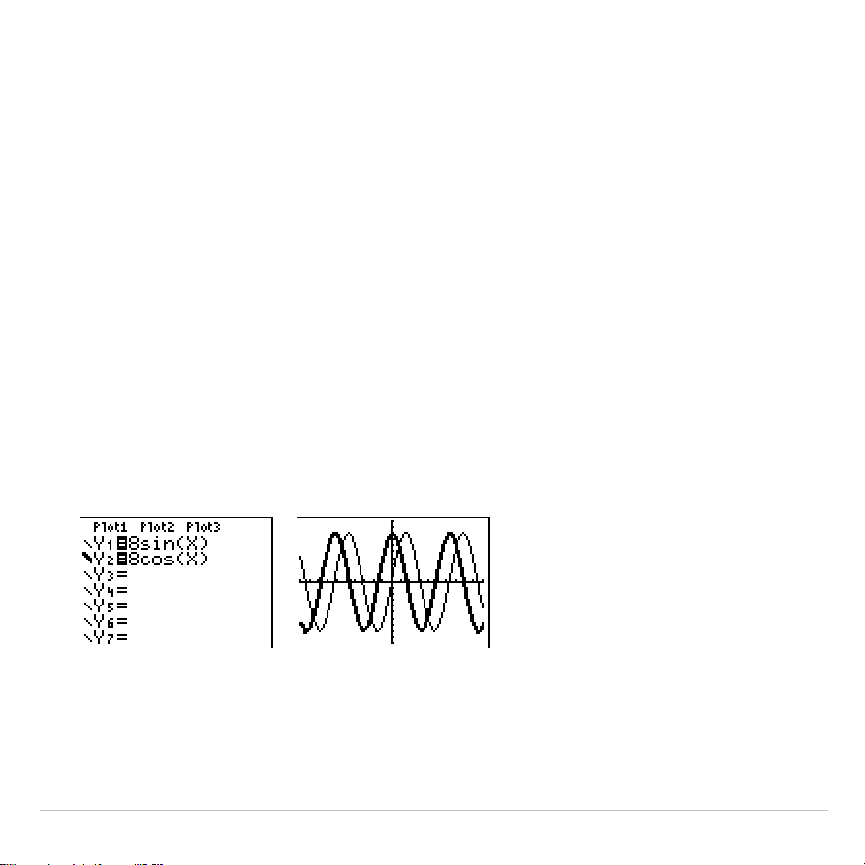
To set the graph style for a function, follow these steps.
1. Press
o
to display the
Y=
editor.
2. Press
†
and
}
to move the cursor to the function.
3. Press
|
|
to move the cursor left, past the
=
sign, to the graph style
icon in the first column. The insert cursor is displayed. (Steps 2 and 3
are interchangeable.)
4. Press
Í
repeatedly to rotate through the graph styles. The seven
styles rotate in the same order in which they are listed in the table
above.
5. Press
~
,
}
, or
†
when you have selected a style.
Loading ...
Loading ...
Loading ...