Loading ...
Loading ...
Loading ...
TI-83 Plus Statistics 372
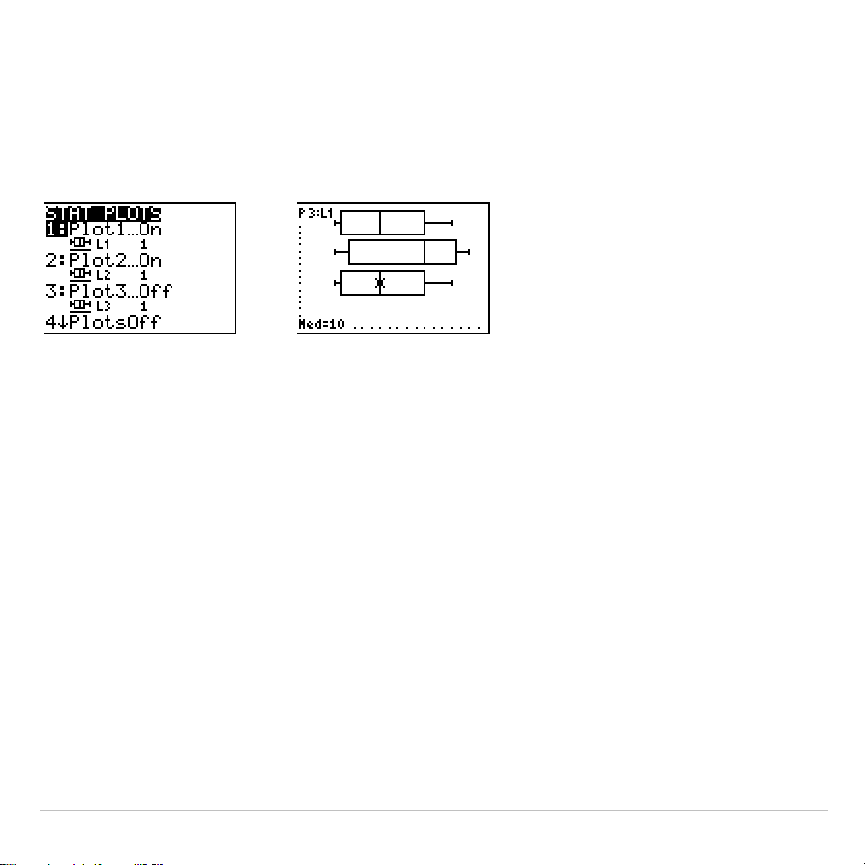
Box plots are plotted with respect to
Xmin
and
Xmax
, but ignore
Ymin
and
Ymax
. When two box plots are plotted, the first one plots at the top of the
screen and the second plots in the middle. When three are plotted, the
first one plots at the top, the second in the middle, and the third at the
bottom.
Ô
(NormProbPlot)
NormProbPlot
(normal probability plot) plots each observation
X
in
Data List
versus the corresponding quantile
z
of the standard normal
distribution. If the plotted points lie close to a straight line, then the plot
indicates that the data are normal.
Enter a valid list name in the
Data List
field. Select
X
or
Y
for the
Data Axis
setting.
•
If you select
X
, the TI-83 Plus plots the data on the x-axis and the
z-values on the y-axis.
•
If you select
Y
, the TI-83 Plus plots the data on the y-axis and the
z-values on the x-axis.
Loading ...
Loading ...
Loading ...