Loading ...
Loading ...
Loading ...
TI-83 Plus Polar Graphing 167
3. Press
q
6
to select
6:ZStandard
and graph
the equation in the standard viewing window.
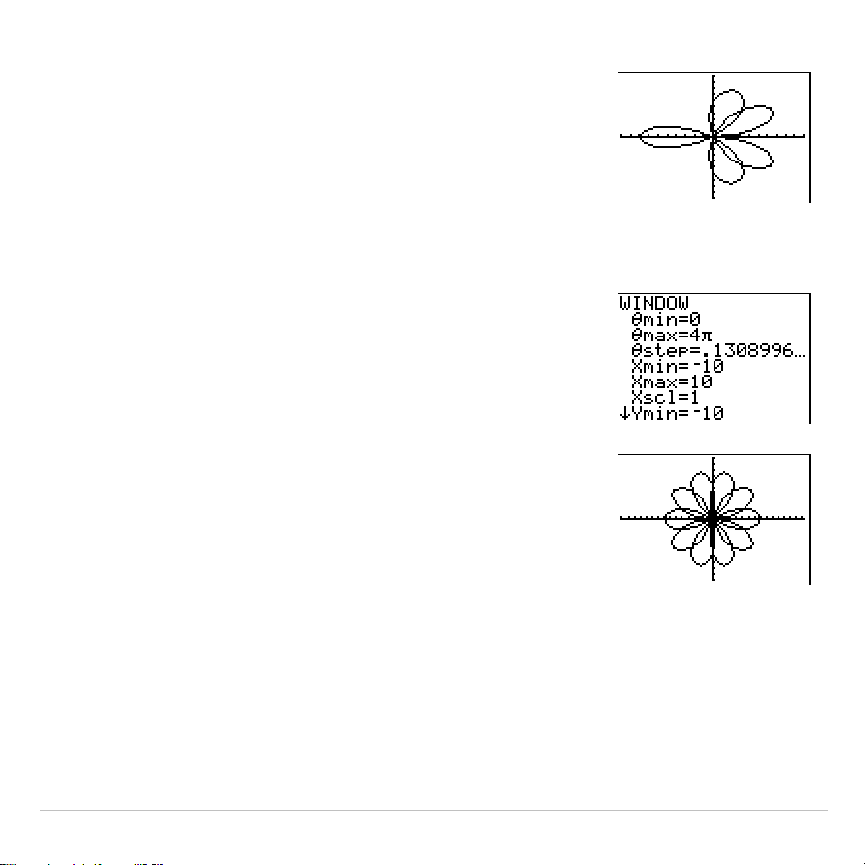
The graph shows only five petals of the rose,
and the rose does not appear to be
symmetrical. This is because the standard
window sets
q
max=2
p
and defines the window,
rather than the pixels, as square.
4. Press
p
to display the window variables.
Press
†
4
y
B
to increase the value of
q
max
to 4
p
.
5. Press
q
5
to select
5:ZSquare
and plot the
graph.
6. Repeat steps 2 through 5 with new values for
the variables
A
and
B
in the polar equation
r1=Asin(B
q
)
. Observe how the new values affect
the graph.
Loading ...
Loading ...
Loading ...