Loading ...
Loading ...
Loading ...
TI-83 Plus Statistics 322
20. Press
o
to display the
Y=
editor.
Press
|
to move the cursor onto the
=
sign,
and then press
Í
to deselect
Y1
. Press
}
Í
to turn off plot 1.
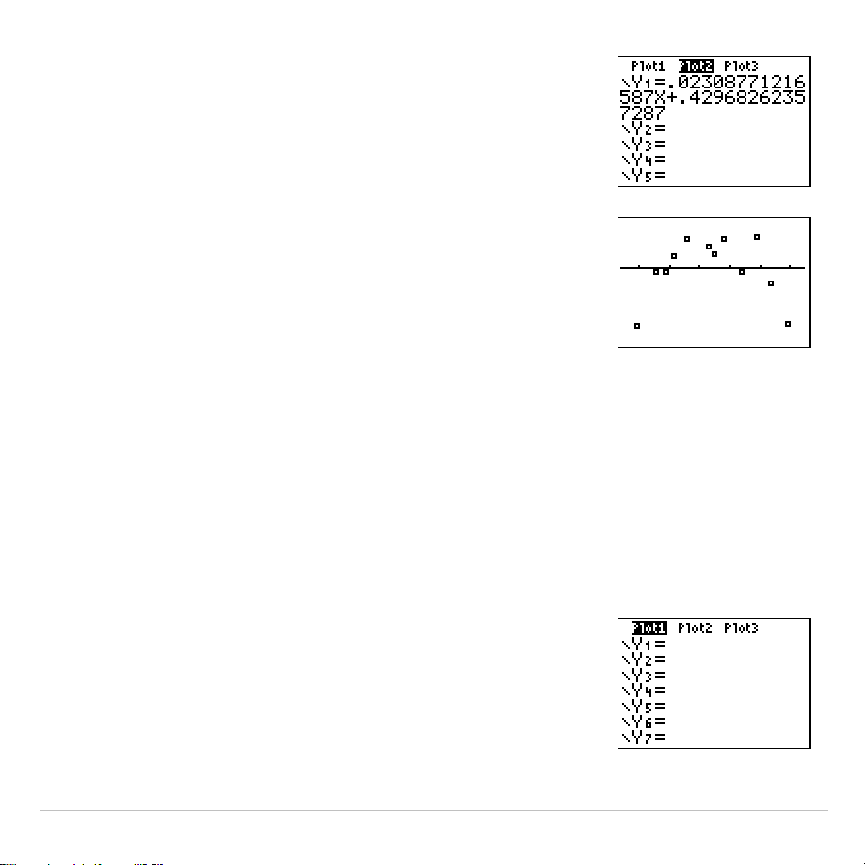
21. Press
q
9
to select
9:ZoomStat
from the
ZOOM
menu. The window variables are
adjusted automatically, and plot 2 is displayed.
This is a scatter plot of the residuals.
Notice the pattern of the residuals: a group of negative residuals, then a
group of positive residuals, and then another group of negative residuals.
The residual pattern indicates a curvature associated with this data set
for which the linear model did not account. The residual plot emphasizes
a downward curvature, so a model that curves down with the data would
be more accurate. Perhaps a function such as square root would fit. Try
a power regression to fit a function of the form y = a
ä
x
b
.
22. Press
o
to display the
Y=
editor.
Press
‘
to clear the linear regression
equation from
Y1
. Press
}
Í
to turn on
plot 1. Press
~
Í
to turn off plot 2.
Loading ...
Loading ...
Loading ...