Loading ...
Loading ...
Loading ...
TI-83 Plus Tables 211
Note:
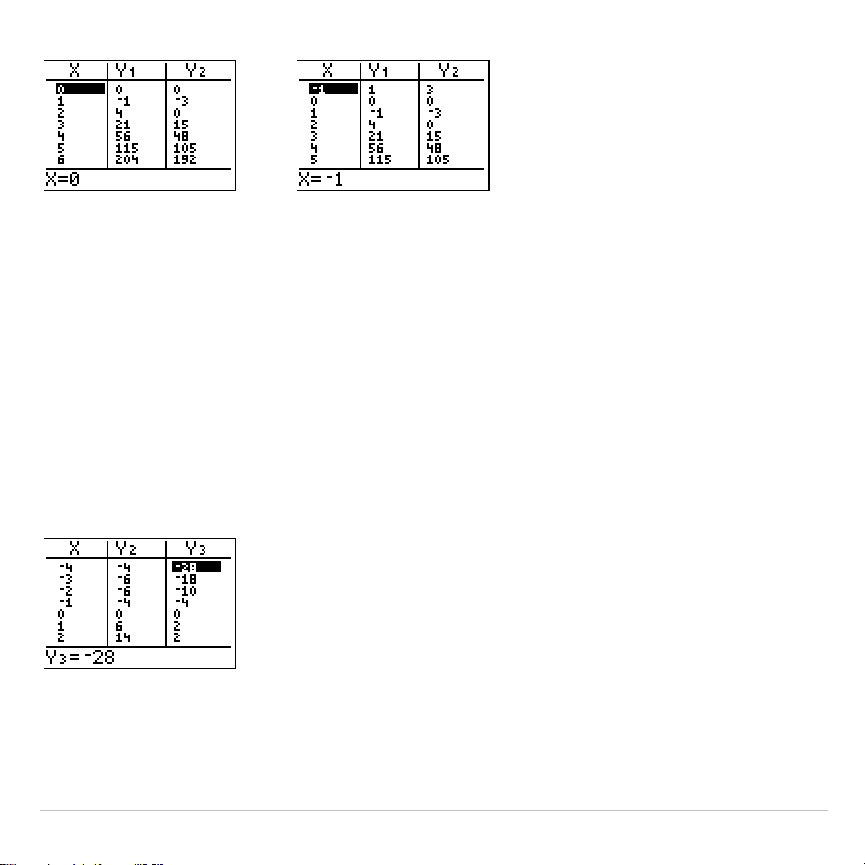
You can scroll back from the value entered for
TblStart
. As you scroll,
TblStart
is updated automatically to the value shown on the top line of the table.
In the example above,
TblStart=0
and
@
Tbl=1
generates and displays values of
X=0
, …,
6
; but you can press
}
to scroll back and display the table for
X=
M
1
, …,
5
.
Displaying Other Dependent Variables
If you have defined more than two dependent variables, the first two
selected
Y=
functions are displayed initially. Press
~
or
|
to display
dependent variables defined by other selected
Y=
functions. The
independent variable always remains in the left column, except during a
trace with
Par
graphing mode and
G
.
T
split-screen mode set.
Tip:
To simultaneously display two dependent variables on the table that are not
defined as consecutive Y= functions, go to the Y= editor and deselect the Y=
functions between the two you want to display. For example, to simultaneously
display
Y
4
and
Y
7
on the table, go to the Y= editor and deselect
Y
5
and
Y
6
.
Loading ...
Loading ...
Loading ...