Loading ...
Loading ...
Loading ...
TI-83 Plus Statistics 369
"
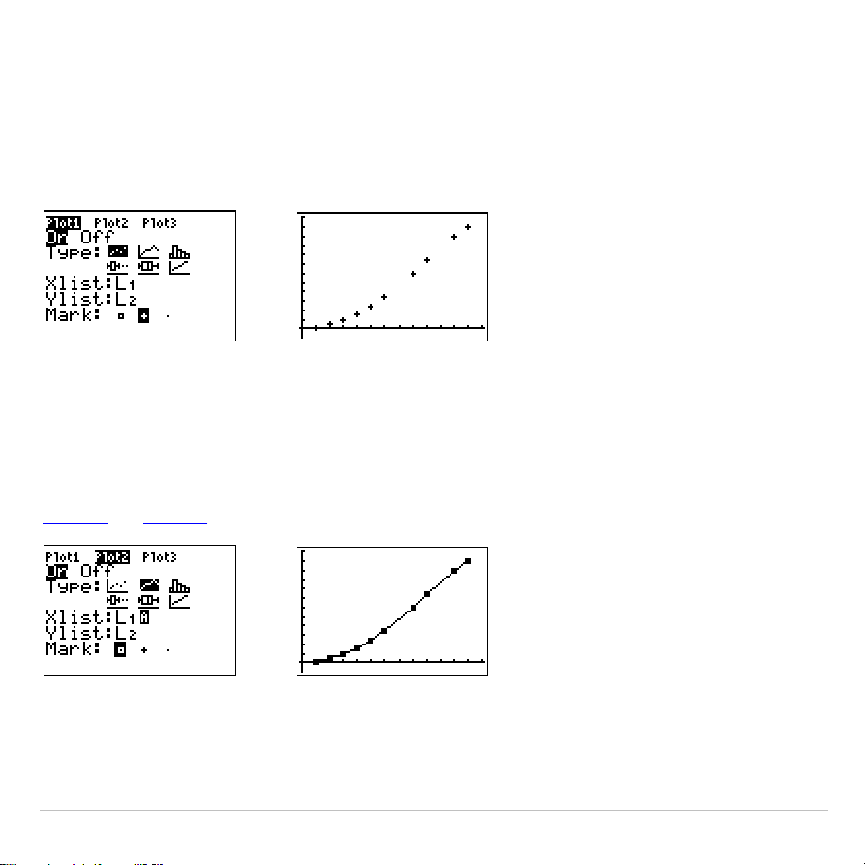
(Scatter)
Scatter
plots plot the data points from
Xlist
and
Ylist
as coordinate pairs,
showing each point as a box (
›
), cross (
+
), or dot (
¦
).
Xlist
and
Ylist
must be the same length. You can use the same list for
Xlist
and
Ylist
.
Ó
(xyLine)
xyLine
is a scatter plot in which the data points are plotted and
connected in order of appearance in
Xlist
and
Ylist
. You may want to use
SortA(
or
SortD(
to sort the lists before you plot them.
Loading ...
Loading ...
Loading ...