Loading ...
Loading ...
Loading ...
www.mucarco.com
www.mucarco.com
1716
you want to stop the reading, click “stop” (the white box before the progress bar). The
diagnostic record is saved in the File module. It can be sent to designated e-mail boxes
and reviewed for troubleshooting and analysis.
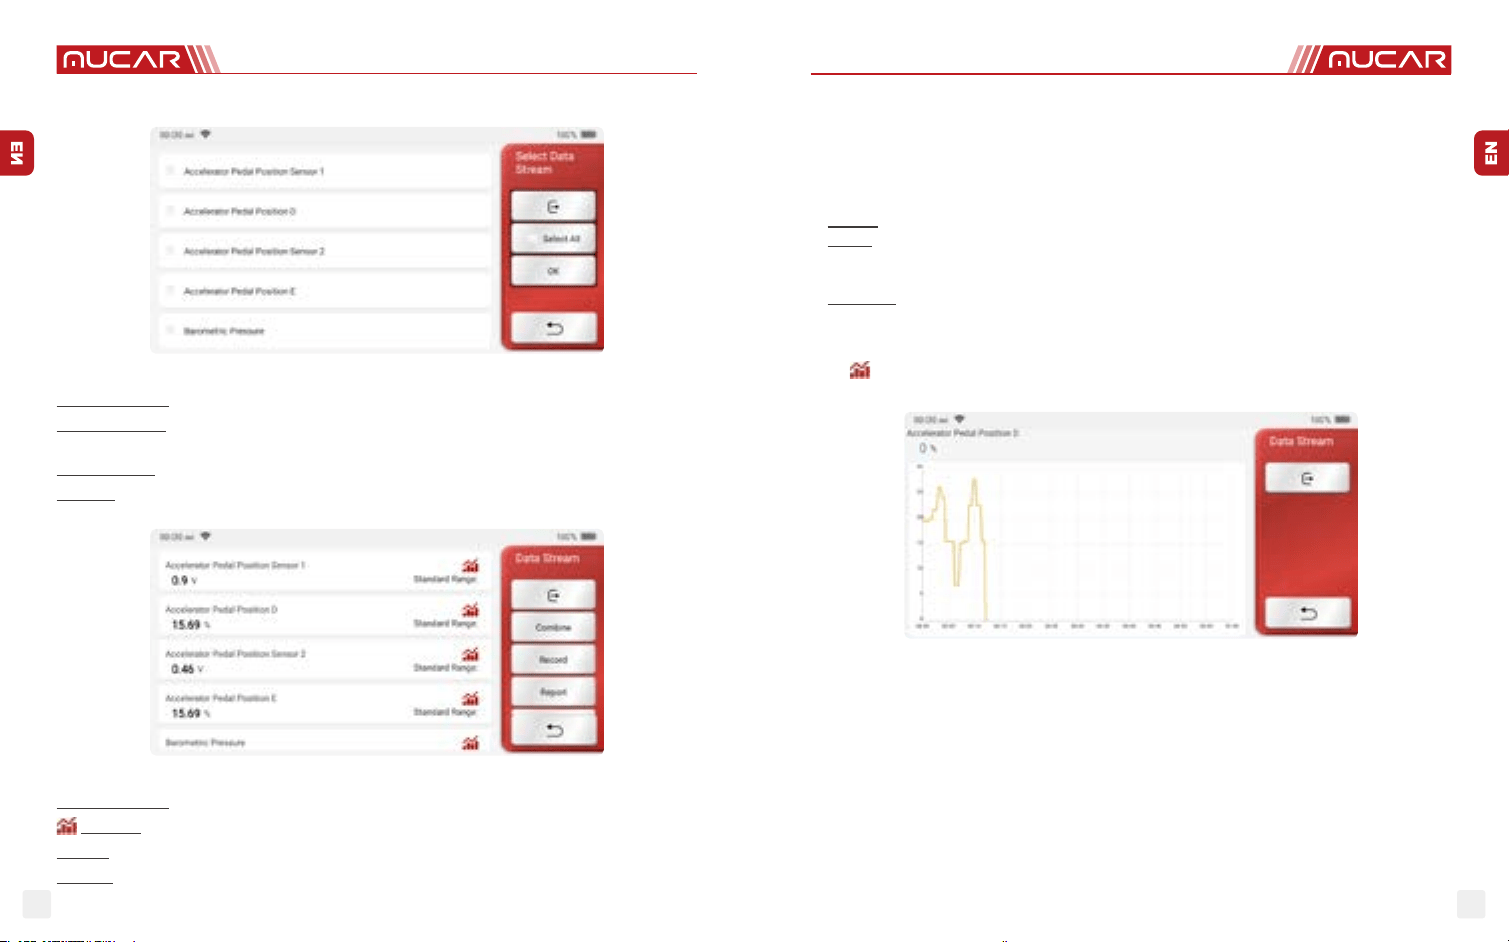
If the 1 / X appears, it means that the data stream options haven’t fully displayed. Swipe
the screen from bottom to top to display the remaining options. With 3 display modes
available, you can browse it with suitable ways:
• Figure: Displays parameters with wave patterns.
• Value: The default display mode shows parameters with numbers and lists.
Note: If the value of the data stream is not within the standard value range, the data stream will be
displayed in red.
• Combine: The graphs are presented together for users to make comparisons.
Note:dierent data ow options are marked in dierent colors.
How to check one wave pattern?
Click
.
On the display page of wave patterns.
Choose the data stream options to be checked (Note: Only a maximum of 4 data streams
can be displayed).
If you want to remove the wave pattern of some data stream, just deselect it.
How to check several wave patterns together?
Click [Combine] button and then the system will display the parameters of the selected
data streams with wave patterns.
the vehicle’s overall performance and oer maintenance suggestions.
Screen buttons:
Select all: If you want to check some data stream, tick the box before its name. If you
want to choose all the data streams, click this button.
Deselect: Click this button to deselect all checked data streams.
OK: Conrm current operations. Click "OK" after selection, and then the system will
display the dynamic data of selected data streams.
Screen buttons:
(Graph): Click it and the data streams are displayed in dynamic wave patterns.
Report: Click the button to save the number of current data streams.
Record: It’s used to record diagnosis data so that users can replay and check it. If
Loading ...
Loading ...
Loading ...