Loading ...
Loading ...
Loading ...

Chapter 19 Bode Plot RIGOL
MSO5000 User Guide 19-1
Chapter 19 Bode Plot
A Bode plot is a graph that maps the frequency response of the system. In the switch
power supply and operational amplifier's circuit feedback network, the Bode plot
provides a curve displaying the variation of gain and phase with the frequency for a
loop analysis. Through the analysis on the gain margin and phase margin of the
system, you can determine the stability of the system.
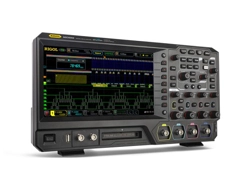
With the built-in signal generator module, the MSO5000 series generates the sweep
signal of a specified frequency range and outputs to the switch power supply circuit
under test. Then, the oscilloscope draws a Bode plot displaying the variation of phase
and gain with different frequencies.
Contents in this chapter:
◼ To Enable the Bode Function
◼ To Run or Stop the Operation
◼ Parameter Setting
◼ Cursor
◼ Display Type
◼ Display
◼ Save
◼ Connection Diagram
Loading ...
Loading ...
Loading ...
