Loading ...
Loading ...
Loading ...
67
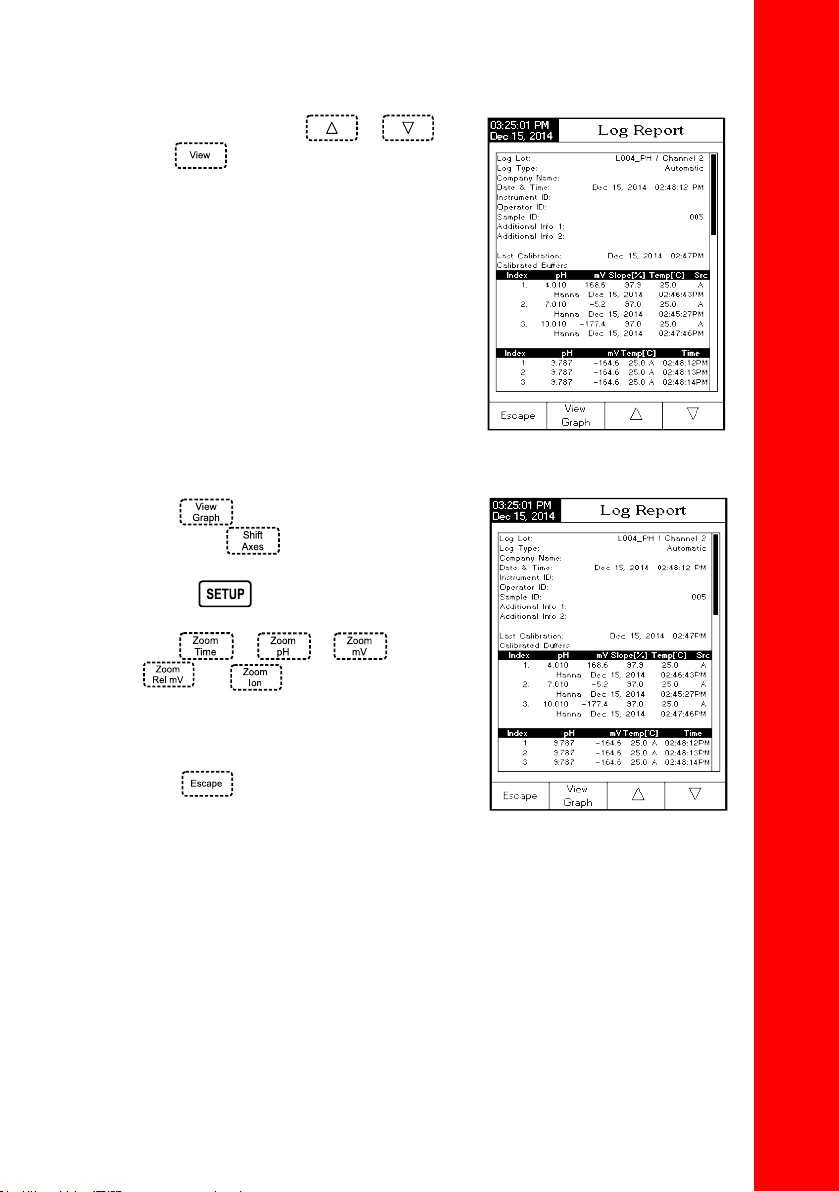
• Select the desired lot with or and
press to display the logged data from the
highlighted lot. The “Please wait...” message will
be displayed on the LCD for one second. The selected
Logging Data Configuration options will be displayed
on the LCD, together with GLP information (last
calibration date and calibrated buffers/standards)
if a calibration has been performed on the selected
mode and the logged values (measured value, mV
value, temperature value, temperature compensation
mode and the logging time).
Note: For automatic logging only, it is possible to view the plotted graph.
Press
to display the graph.
By pressing
it is possible to move the
graph along the X or Y axis with the arrow keys.If
pressing
while the graph is displayed, the
zoom menu for the X and Y axes will be accessed.
Press
or / /
/ to switch between the
active zooming axes and then zoom in or out
on the selected axis by pressing the appropriate
virtual key.
• Press
to return to the previous menu at
any time.
LOGGING
Loading ...
Loading ...
Loading ...