Loading ...
Loading ...
Loading ...
13
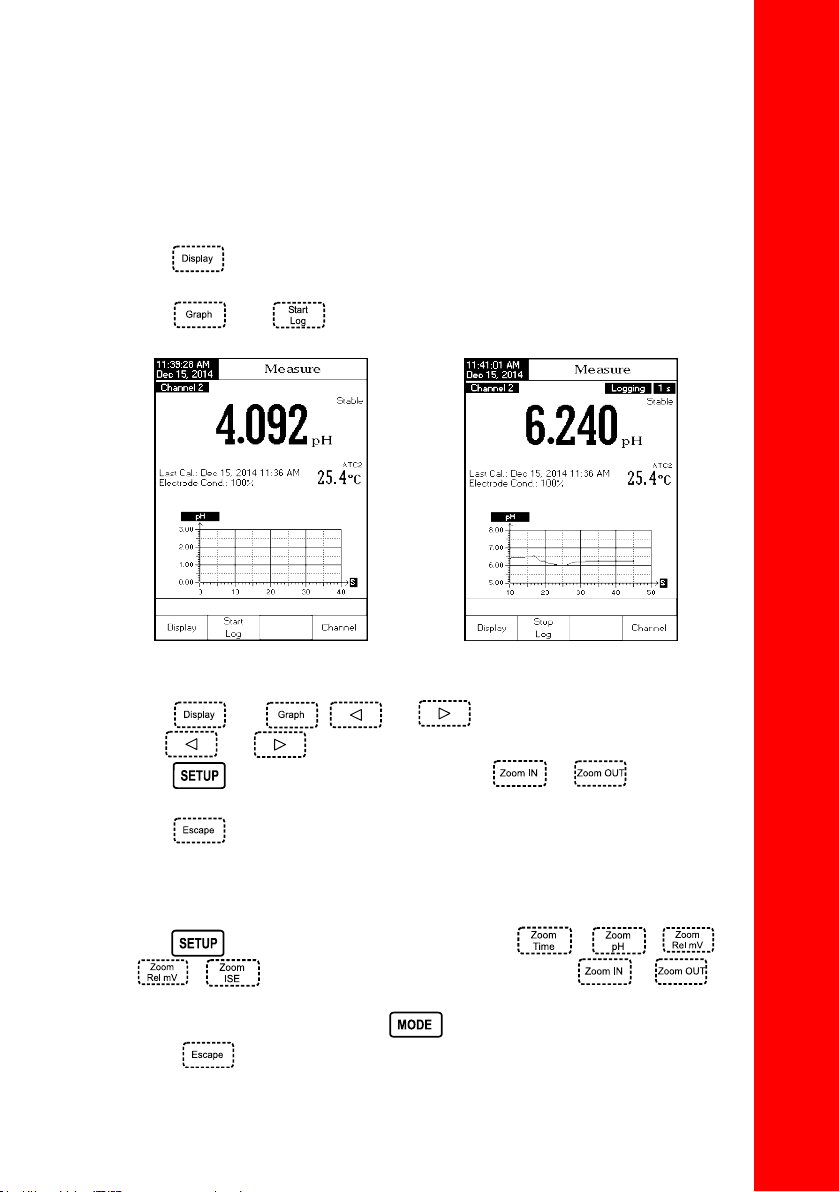
Graph
The on-line graph with currently logged values (pH, mV, Rel mV, or ISE vs. Seconds) will be
displayed when this option is selected.
If there is no active log, the previously logged data for the selected parameter will be shown.
To access the off-line / on-line graph:
• Press while in Measure / Logging mode. The “Choose Display Configuration” message
will be displayed in the Reminder messages area.
• Press . Press to begin an online graph.
To Zoom Graph
• Press
then . and will appear in virtual keys.
• Use
and to move along the X (Time) axis of the graph.
• Press
to access the zoom menu for Y axis. Use or for zooming Y
(parameter) axis.
• Press
to return to the main menu.
When the off-line graph is displayed:
• Use the arrow keys to move along the X (Time) and Y (parameter) axes of the graph.
• Press
to access the zoom menu for X and Y axes. Use or / /
/ to switch between the active zooming axes. Press or to
zoom the selected axis.
Note: While in zoom graph menu the
key is not accessible.
Press
to return to the main menu.
DISPLAYING MODES
Loading ...
Loading ...
Loading ...