Loading ...
Loading ...
Loading ...
Title Ground Contact Time Balance Data
Identifier GUID-B917540E-186D-4546-943F-4CD694B11BDC
Language EN-US
Description
Version 3
Revision 4
Changes Conditioned statement for black and white screen
Status Released
Last Modified 20/01/2022 18:02:07
Author tillmonmartha
Ground Contact Time Balance Data
NOTE: In the Garmin Connect activity, the running dynamics data displays as colored graphs.
Ground contact time balance measures your running symmetry and appears as a percentage of your total
ground contact time. For example, 51.3% with an arrow pointing left indicates the runner is spending more time
on the ground when on the left foot. If your data screen displays both numbers, for example 48–52, 48% is the
left foot and 52% is the right foot.
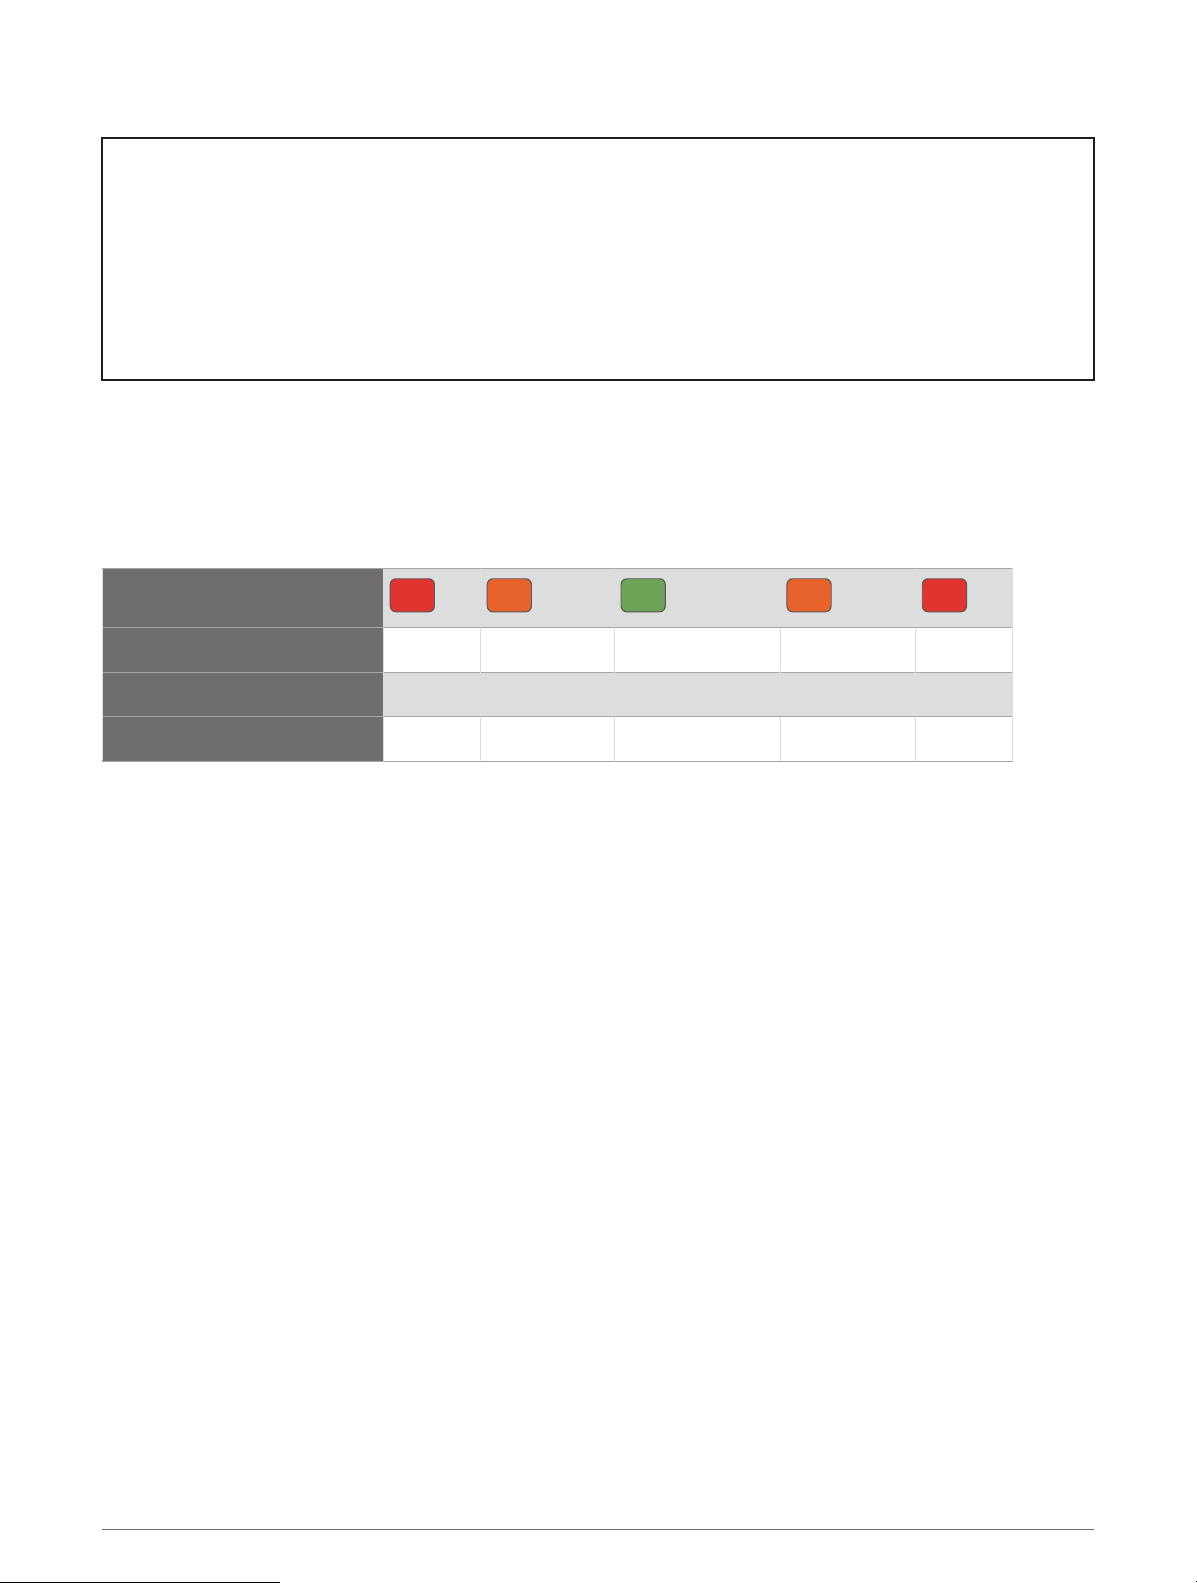
Color Zone
Red Orange Green Orange Red
Symmetry Poor Fair Good Fair Poor
Percent of Other Runners 5% 25% 40% 25% 5%
Ground Contact Time Balance >52.2% L 50.8–52.2% L 50.7% L–50.7% R 50.8–52.2% R >52.2% R
While developing and testing running dynamics, the Garmin team found correlations between injuries and
greater imbalances with certain runners. For many runners, ground contact time balance tends to deviate
further from 50–50 when running up or down hills. Most running coaches agree that a symmetrical running
form is good. Elite runners tend to have quick and balanced strides.
You can watch the gauge or data field during your run or view the summary on your Garmin Connect account
after your run. As with the other running dynamics data, ground contact time balance is a quantitative
measurement to help you learn about your running form.
Appendix 205
Loading ...
Loading ...
Loading ...